Metabolites are small molecular-weight compounds that are heavily involved in the biological processes within an organism and are related to activities such as cell growth, cell reproduction and a cellular response to the environment. The importance of metabolites lies in the fact that their existence and concentration changes are in response to the real-time enzyme activities. Metabolomics, the study of a complete set of metabolites, can be used to describe the status of key proteins or evaluate the activity of entire pathways, bridging the gap between genotype and phenotype. Correspondingly, the metabolome reflects the state of the cell, tissue, organ, or organism being investigated. Metabolomics incorporate multiple disciplines into one research program, including but not limited to: qualitative and quantitative measurement of intra/intercellular metabolites, chemometric analysis of high-throughput metabolic data, and the prediction of certain regulatory pathways. The metabolome can be perturbed by chemicals (i.e. drugs), by biology (i.e. mutations), by phenotype (i.e. disease), or by the environment (i.e. nutrients). Differential metabolomics focuses on the changes in the metabolome that occurs between control and treated samples in order to understand the biological system under investigation.
Nuclear magnetic resonance (NMR) can be used to capture a snapshot of the metabolome from a cell or organism based on the identification of the metabolites and their respective concentrations. NMR-based metabolomics has the advantage of being highly specific, non-invasive and high throughput. Since small molecules vary in sizes, structure, solubility, concentration and stability, we are developing efficient sampling methods based on these properties, and the sources of the various metabolomics samples: bacterial and human cell lines, tissues, and biofluids (urine, serum) from animals and humans. Automation and optimization of the NMR metabolomics protocol are also a major aspect of our effort. Similarly, mass spectrometry has been newly incorporated into our metabolomics protocols, where the combination of these two complementary techniques significantly increases the resolution of the analysis by providing a more detailed and a more comprehensive identification of the metabolome.
Differential metabolomics can be applied for drug discovery, disease biomarker identification, and metabolic pathway construction. Our group has several collaborative projects that focus on these three research areas. In drug discovery, the metabolome of drug resistant strains of Staphylococcus aureus are being examined to understand the mechanism of drug resistance. Similarly, we are investigating biological processes related to biofilm formation, adaptability, survivability, and cell death for S. aureus and S. epidermidis. Specifically, we are investigating the disruption of carbon flux through the Pta-AckA pathway as a key factor in bacterial cell death. Also, we recently demonstrated that the tricarboxylic acid (TCA) cycle is a major regulator in biofilm formation. These are all critical processes with important ramifications in regards to developing new antibiotics. Mycobacterium bacteria are also being studied to identify new drugs with novel protein targets to avoid common mechanisms of resistance. We are also deciphering the in vivo mechanism of action for established TB drugs (i.e. D-cycloserine) and fatty-acid analogs (mycolic acids) in order to develop next-generation drugs with increased efficacy and diminished toxicity issues.
Diagnosing a disease and evaluating the effectiveness of a treatment can be a very challenging endeavor. One approach to address this issue is through the identification of disease-associated metabolites present in biofluids (urine, serum, etc.). Obtaining urine samples, in particular, is a non-invasive, inexpensive, and easy approach to monitor a disease, its progression and treatment. We are currently applying NMR and MS metabolomics to discover novel biomarkers for the early onset of Parkinsons Disease (PD) by using environmental toxins induced PD models. The approach is also being applied to identify metabolite pathways altered by MUC1 overexpression as a promising diagnose tool for early-stage pancreatic cancer. We have also shown the ability to differentiate between gemcitabine-resistant and -susceptible pancreatic cells, which have the promise to aid in personalized medicine. Similarly, we have shown that urine metabolites can be used to monitor the progression and treatment of multiple sclerosis in a mouse model.
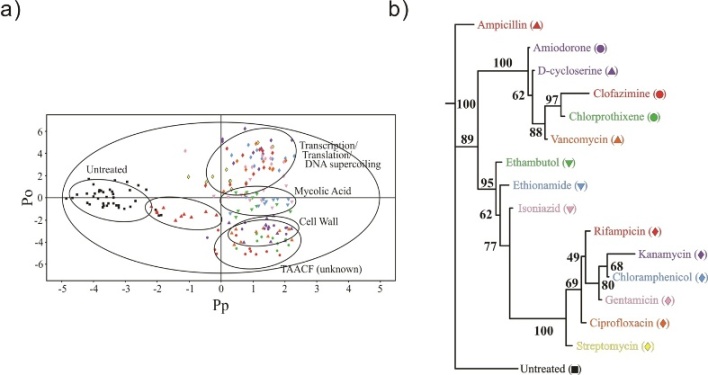
Figure 1 a) 2D OPLS-DA scores plot demonstrating the clustering pattern for 12 antibiotics with known biological targets and three compounds of unknown in vivo activity: untreated M. smegmatis cells, chloramphenicol, ciprofloxacin, gentamicin, kanamycin, rifampicin, streptomycin, ethambutol, ethionamide, isoniazid, ampicillin, D-cycloserine, vancomycin, amiodorone, chlorprothixene, and clofazimine treated M. smegmatis cells. The symbols correspond with the coloring scheme and labeled symbols indicated on the tree diagram in b). The ellipses correspond to the 95% confidence limits from a normal distribution for each cluster. The untreated M. smegmatis cells (black square) was designated the control class, and the remainder of the cells were designated as treated. The OPLS-DA used one predictive component and six orthogonal components to yield a R2X of 0.715, R2Y of 0.803, and Q2 of 0.671. b) Metabolomics tree diagram determined from the OPLS-DA scores plot. The coloring scheme and associated symbol for each compound in the tree diagram correlates with colored symbols in the OPLS-DA scores plot. The bootstrap numbers for each node are indicated on the tree diagram.
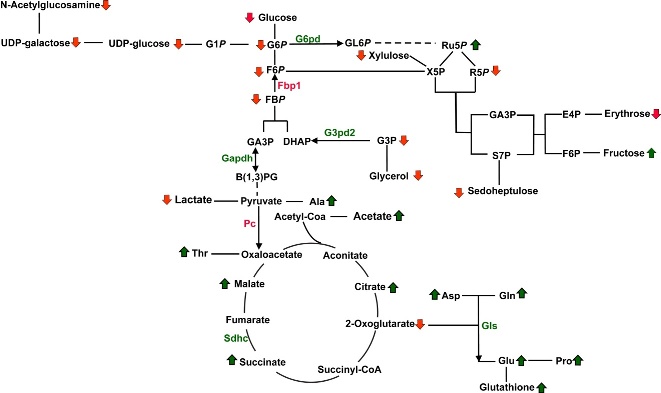
Figure 2. Metabolic pathway depicting the metabolites identified in the S2-013.MUC1 and S2-013.Neo cellular metabolome by the 2D 1H-13C HSQC NMR experiments. Three replicates of S2-013.MUC1 and S2-013.Neo cell cultures were used for metabolite identification. Dark green arrows correspond to metabolites with an increased concentration in S2-013.MUC1 cells relative to S2-013.Neo cells. Arrows colored red correspond to metabolites with a decreased concentration in S2-013.MUC1 cells relative to S2-013.Neo cells. Metabolic genes up- or down-regulated by MUC1 expression are indicated by green and red, respectively. Most glycolytic genes are not depicted for clarity. (D) Cells (5e4) were seeded and cultured under normoxic or hypoxic conditions (1% O2) in regular or glucose/glutamine-deprived media for 3 d. Cell counts at day 3 are indicated by vertical bars+/-SEM (n = 3; *p< 0.05 and ***p< 0.001 vs. counts of S2-013.Neo cells for that condition).
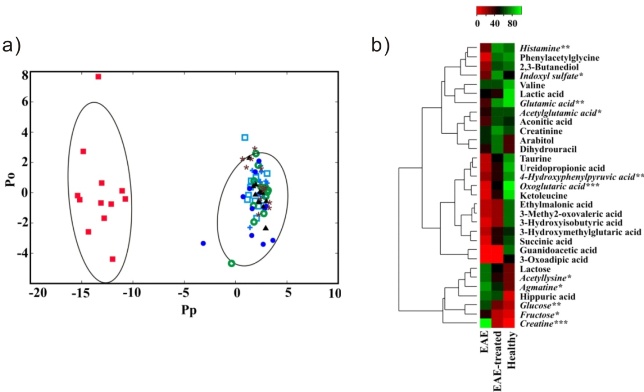
Figure 3. a) 2D OPLS-DA scores plot generated from the 1D 1H NMR spectra acquired for the urine samples from the seven treatment groups namely: healthy (+), saline (solid triangle), CFA (cicrle/w slash), EAE (solid box), saline-treated (open box), CFA-treated (open cicle), and EAE-treated mice (solid cicle). The OPLS-DA used one predictive component and one orthogonal component to yield a R2X of 0.690, R2Y of 0.938 and Q2 of 0.841. The CV-ANOVA validation of the OPLS-DA class distinctions yielded a p-value of 1.55e-31. The ellipses correspond to the 95% confidence limits from a normal distribution for each cluster. b) Heat map generated from the normalized relative intensity of the corresponding metabolite peak obtained from the 2D 1H-13C HSQC NMR spectrum. The dendrogram represents a hierarchal clustering of the metabolites according to relative concentration changes between healthy, EAE and EAE-treated mice. Metabolites significantly altered in the urine from EAE, but not in EAE-treated mice are in italics (p<0.05 *, p<0.01**, p<0.001***).
References
- (102) S. Halouska and R. Powers* (2013) "NMR in Drug Discovery - Introduction", Encyclopedia of Biophysics, 3:1713-1724.
- (96) B. Worley, and R. Powers* (2013) "Multivariate Analysis in Metabolomics", Current Metabolomics, 1(1):92-107 PMC44651877.
- (97) T. Gebregiworgis, C. Massilamany, A. Gangaplara, S. Thulasingam, V. Kolli, M. T. Wertha, E. D. Dodds, D. Steffen, J. Reddy* and R. Powers* (2013) "Potential of Urinary Metabolites for Diagnosing Multiple Sclerosis", ACS Chem. Biol., 8(4):684-690 PMC3631445.
- (95) B. Worley, S. Halouska and R. Powers* (2013) "Utilities for Quantifying Separation in PCA/PLS-DA Scores", Anal. Biochem., 433(2):102-104 PMC3534867.
- (94) N. V. Chaika,T. Gebregiworgis, M. E. Behrens, P. Radhakrishnan, B. Zhang, X. Liu, V. Purohit, K. Mehla, T. Caffrey, F. Yu, K. R. Johnson, R. Powers, M. A. Hollingsworth and P. K. Singh* (2012) "MUC1 mucin stabilizes and activates hypoxia-inducible factor 1 alpha to regulate metabolism in pancreatic cancer", Proc. Natl. Acad. Sci. U. S. A., 109(34):13787-13792 PMC3427054.
- (92) J. C. Copeland, L. J. Zehr, R. Cerny, and R. Powers* (2012) "The applicability of molecular descriptors for designing an electrospray ionization mass spectrometry compatible library for drug discovery", Comb. Chem. High Throughput Screening, 15(10):806-815 PMC6645700.
- (91) B. Zhang and R. Powers* (2012) "Analysis of bacterial biofilms using NMR-based metabolomics", Future Med. Chem., 4(10):1273-1306 PMC3564560.
- (90) T. Gebregiworgis and R. Powers* (2012) "Application of NMR Metabolomics to Search for Human Disease Biomarkers", Comb. Chem. High Throughput Screening, 15(8):595-610 PMC6625354.
- (88) B. Worley, G. Richard, G. S. Harbison and R. Powers* (2012) "13C NMR Reveals No Evidence of n - π* Interactions in Proteins", PLoS ONE, 7(8):e42075 PMC3410932.
- (87) S. Halouska, R. J. Fenton, R. G. Barletta and R. Powers* (2012) "Predicting the in vivo Mechanism of Action for Drug Leads Using NMR Metabolomics", ACS Chem. Biol., 7(1):166-171 PMC3262886.
- (77) M. R. Sadykov, B. Zhang, S. Halouska, J. L. Nelson, L. W. Kreimer,Y. Zhu, R. Powers*, and G A. Somerville* (2010) "Using NMR metabolomics to investigate tricarboxylic acid cycle dependent signal transduction in Staphylococcus epidermidis", J. Biol. Chem., 285(47):36616-24. PMC2978590.
- (74) M. T. Werth, S. Halouska, M. D. Shortridge, B. Zhang and R. Powers* (2010) "Analysis of Metabolomic PCA Data using Tree Diagrams", Anal. Biochem., 399(1):58-63. PMC2824058.
- (65) M.R. Sadykov, M. E. Olson, S. Halouska, Y. Zhu, P. D. Fey, R. Powers and G. A. Somerville (2008) "Tricarboxylic acid cycle dependent regulation of Staphylococcus epidermidis polysaccharide intercellular adhesin synthesis", J. Bacteriol., 130(23):7621-7632. PMC2583607.
- (60) S. Halouska, O. Chacon, R. Fenton, D. Zinniel, R. G. Barletta, and R. Powers* (2007) "Use of NMR Metabolomics to Analyze the Targets of D-cycloserine in Mycobacteria: Role of D-Alanine Racemase", J. Proteome Res., 6(12):4608-4614. PMC2566856.
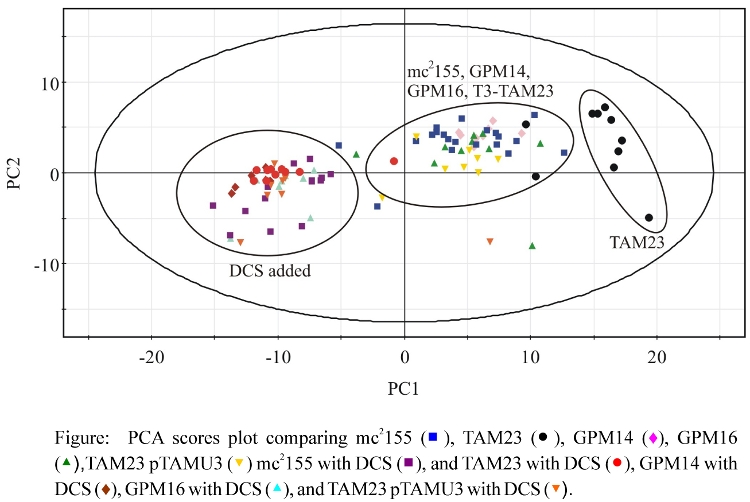
- (57) P. Forgue, S. Halouska, M. Werth, K. Xu, S. Harris and R. Powers* (2006) "NMR Metabolic Profiling of Aspergillus nidulans to Monitor Drug and Protein Activity", J. Proteome Res., 5(8):1916-1923. PMID16889413.
Picture Gallery
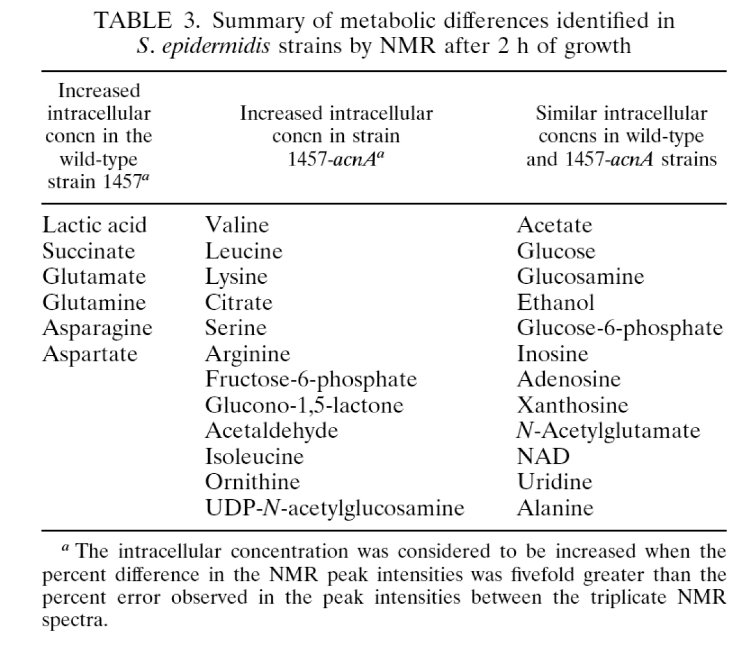
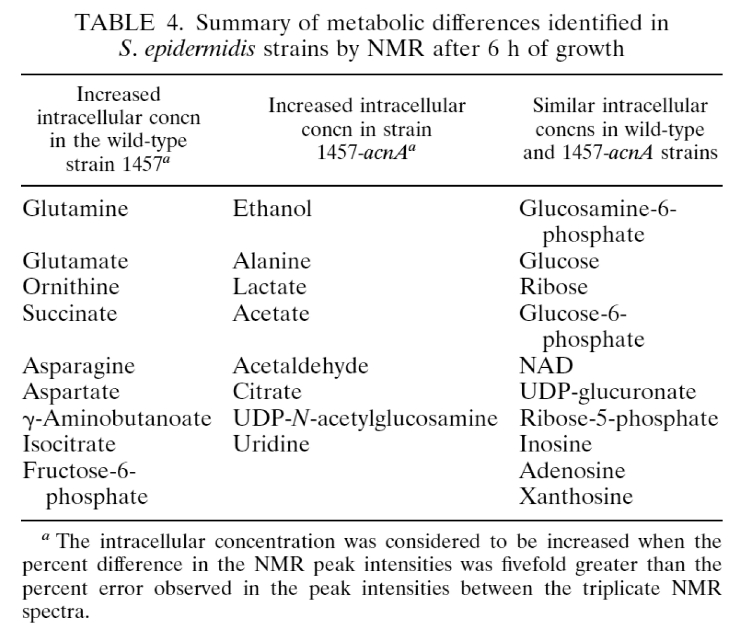
- From: Journal of Bacteriology (2008)
- Summary of metabolic differences by NMR after two hours growth
- Summary of metabolic differences by NMR after six hours growth
- From: Journal of Proteome Research (2007)
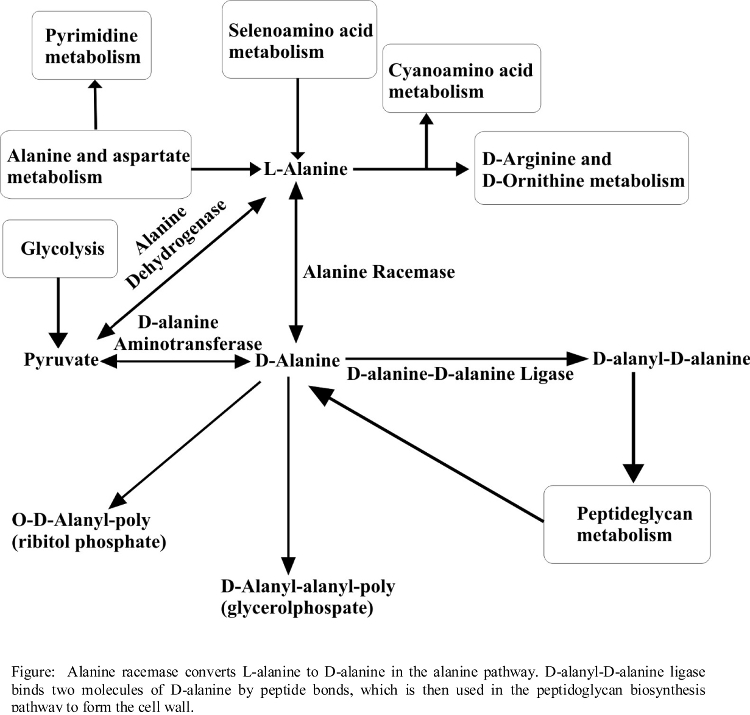
- Metabolic Pathways Associated with DCS Activity
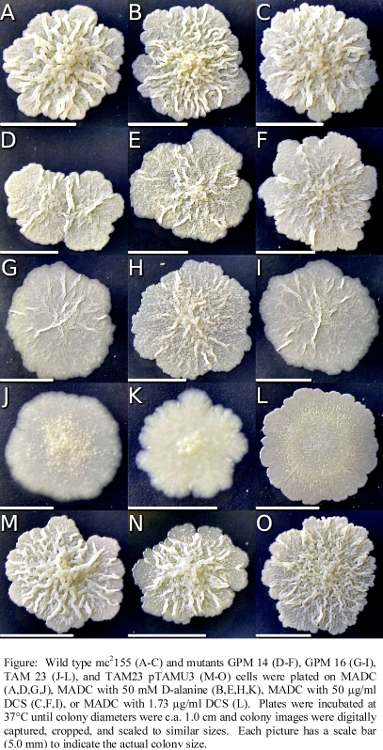
- Illustration of the mutant and wild-type Mycobacterium smegmatis cell lines and the effect of DCS
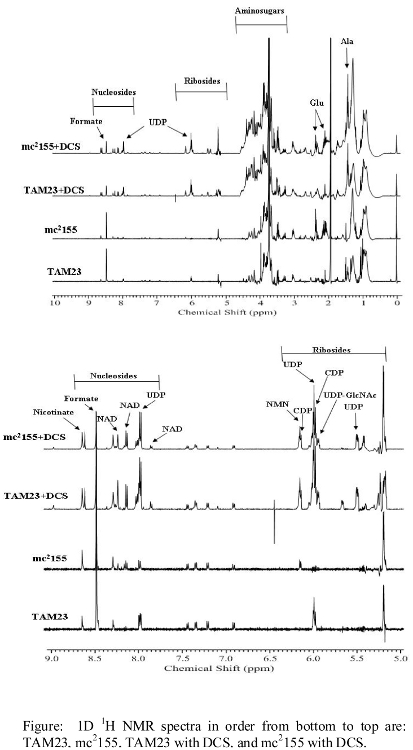
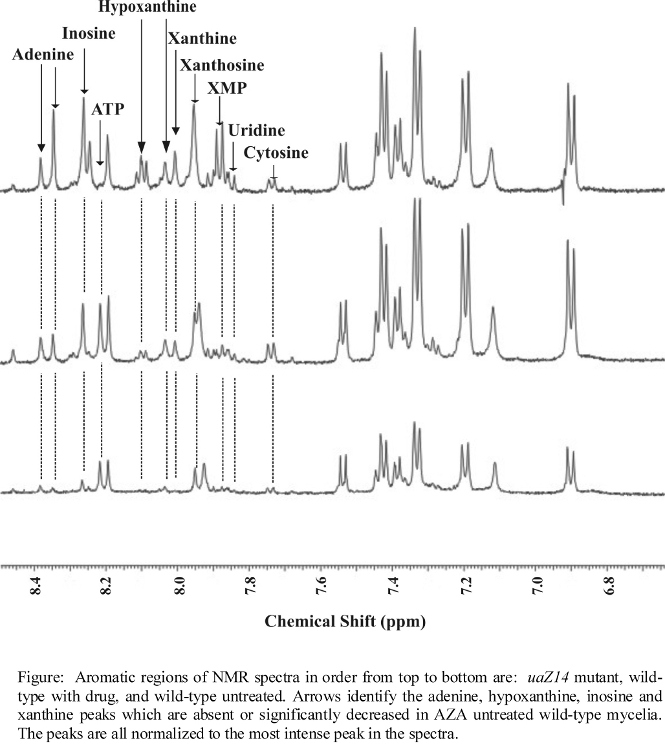
- NMR spectra illustrating major changes in metabolite concentrations
- PCA Results
- From: Journal of Proteome Research (2006)
- Metabolic pathways analyzed by NMR metabolomics
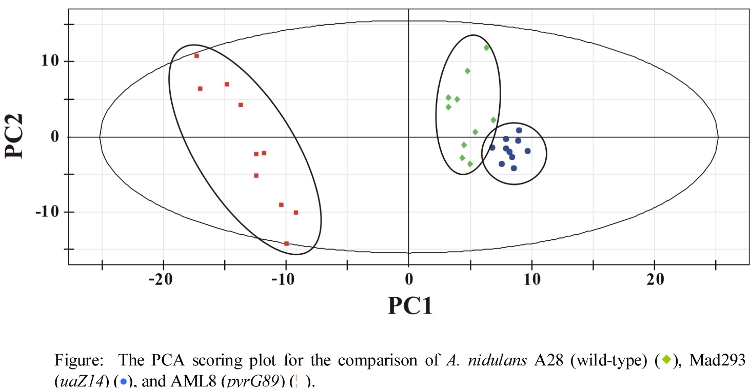
- PCA comparison of wild-type and mutant A. nidulans
- Theoretical PCA plot for drug activity and specificity
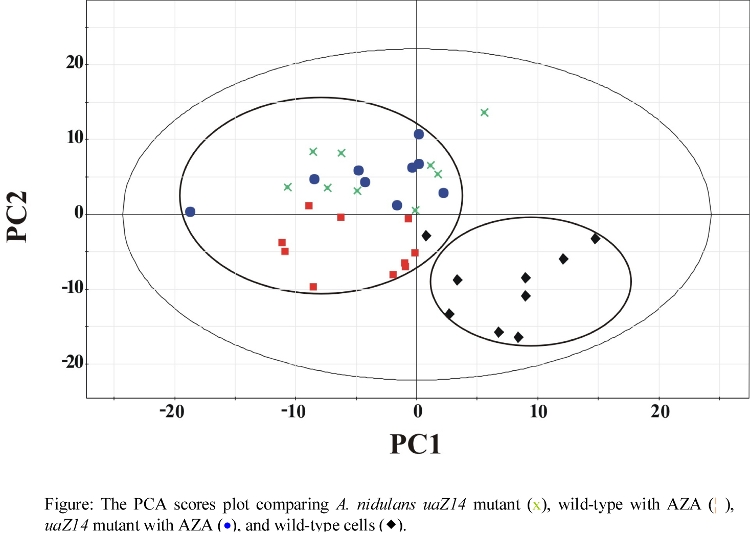
- Effect of AZA on A. nidulans
- PCA Results
- NMR spectra illustrating major changes in metabolite concentrations
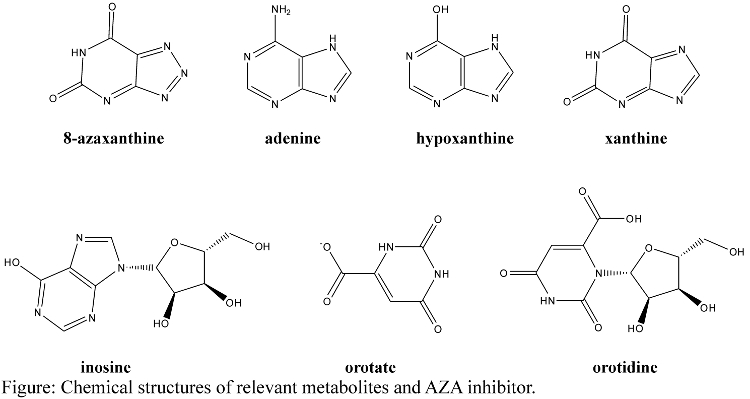
- Structures of relevant metabolites
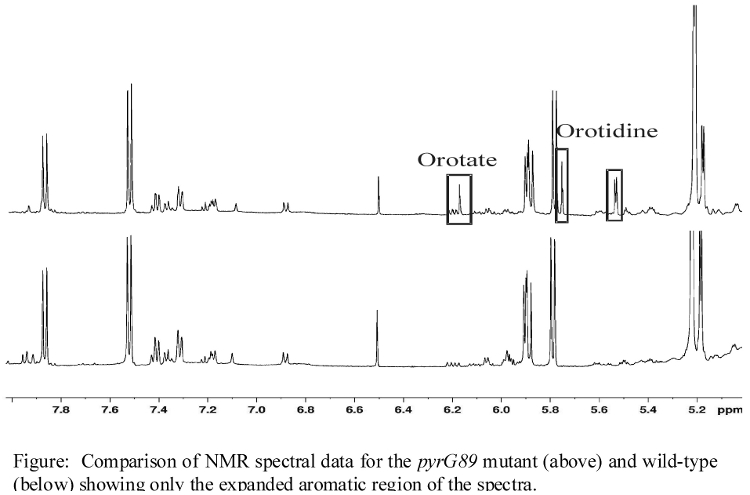
- Additional NMR spectra illustrating changes in metabolite concentrations
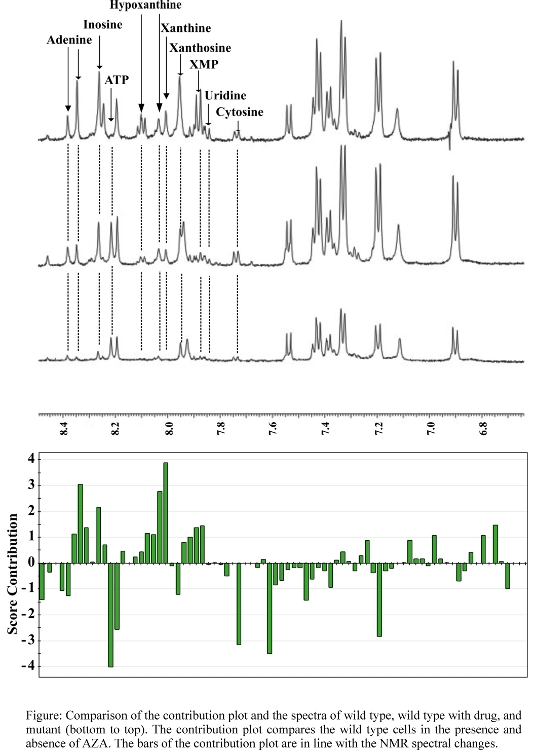
- Comparison of NMR spectra and scores plot contribution
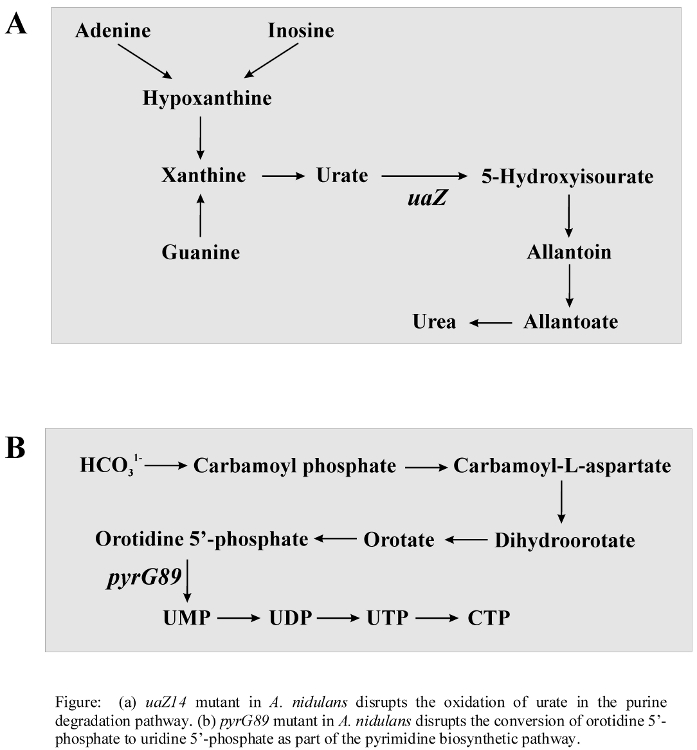
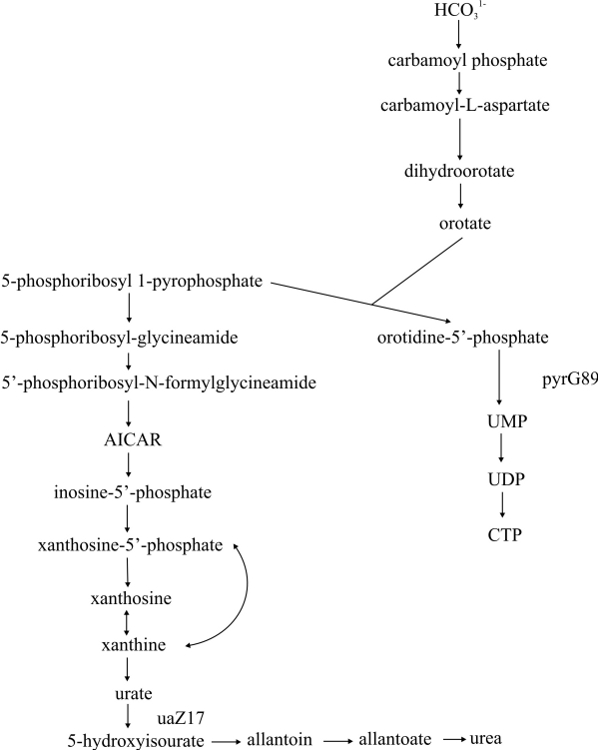
- Purine and pyrimidine biosynthetic super pathway


