Uncategorized files
Showing below up to 49 results in range #21 to #69.
View (previous 50 | next 50) (20 | 50 | 100 | 250 | 500)
 Binding Sheets.xls ; 36 KB
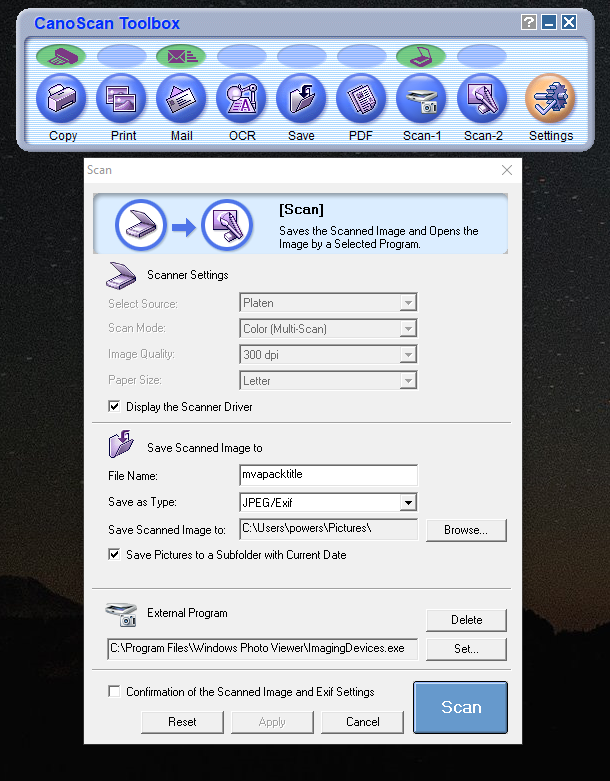 CanoScan Toolbox.png 610 × 781; 203 KB
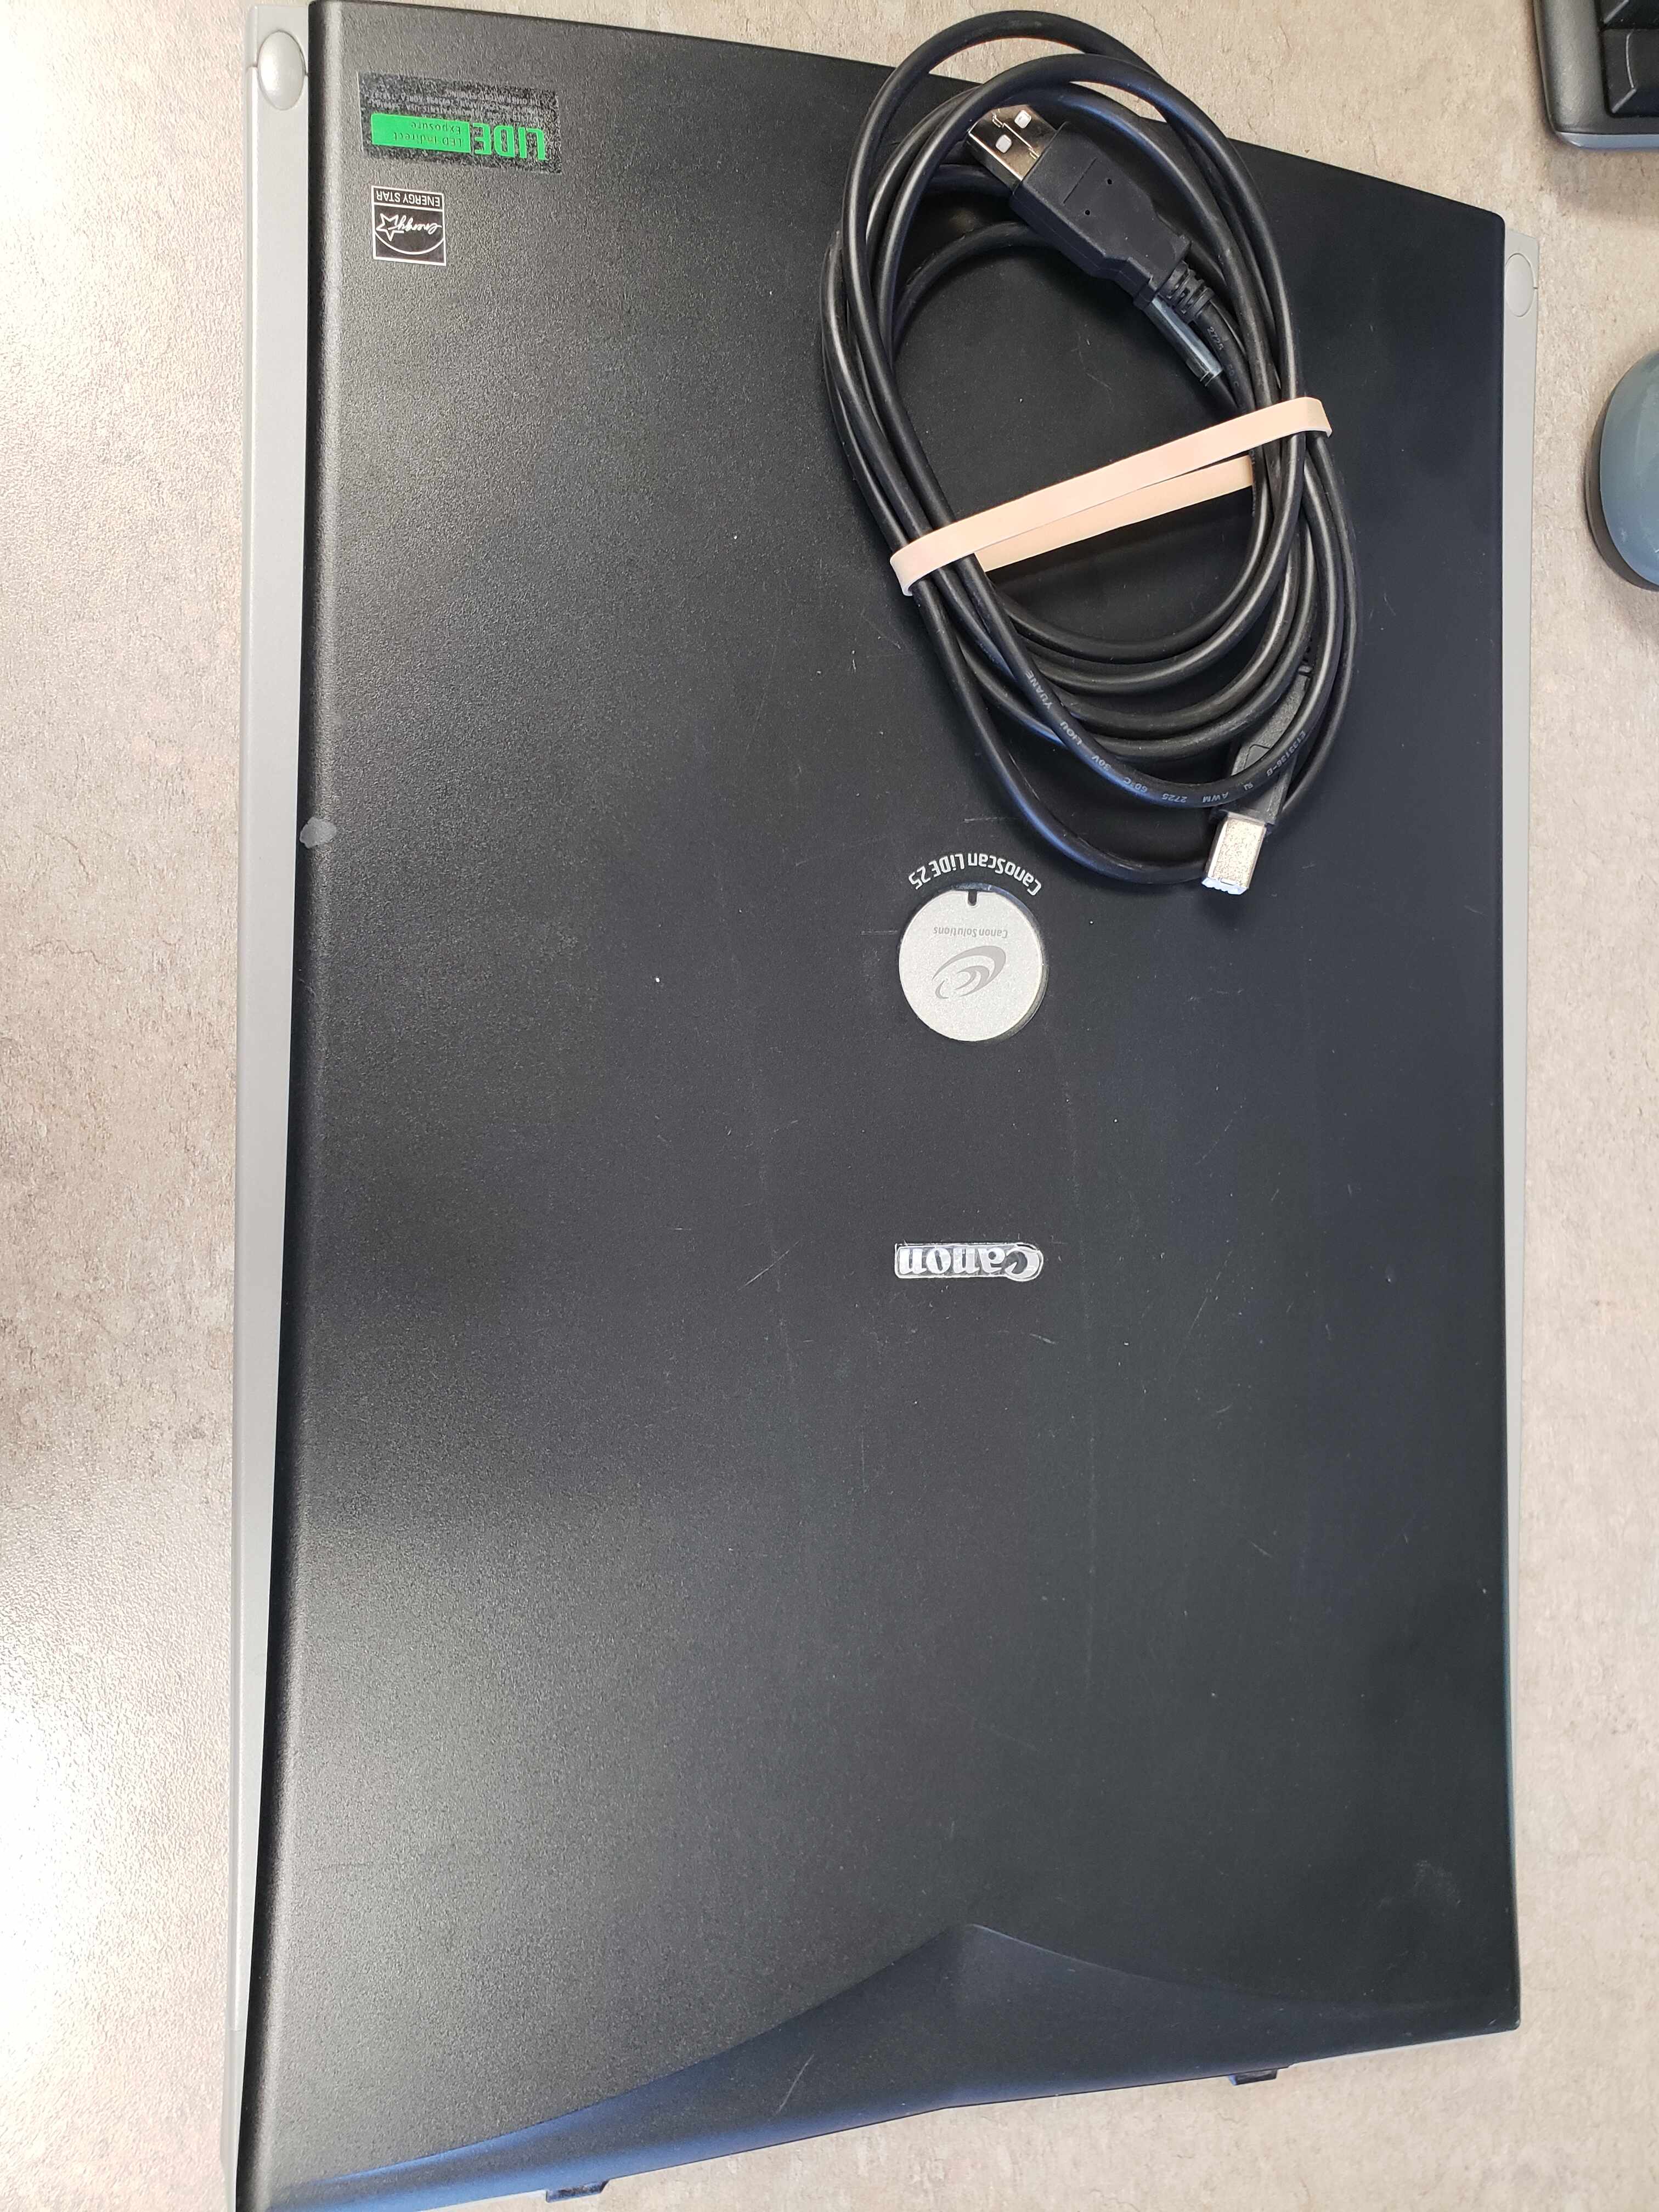 Canonscanner.jpg 4,032 × 3,024; 870 KB
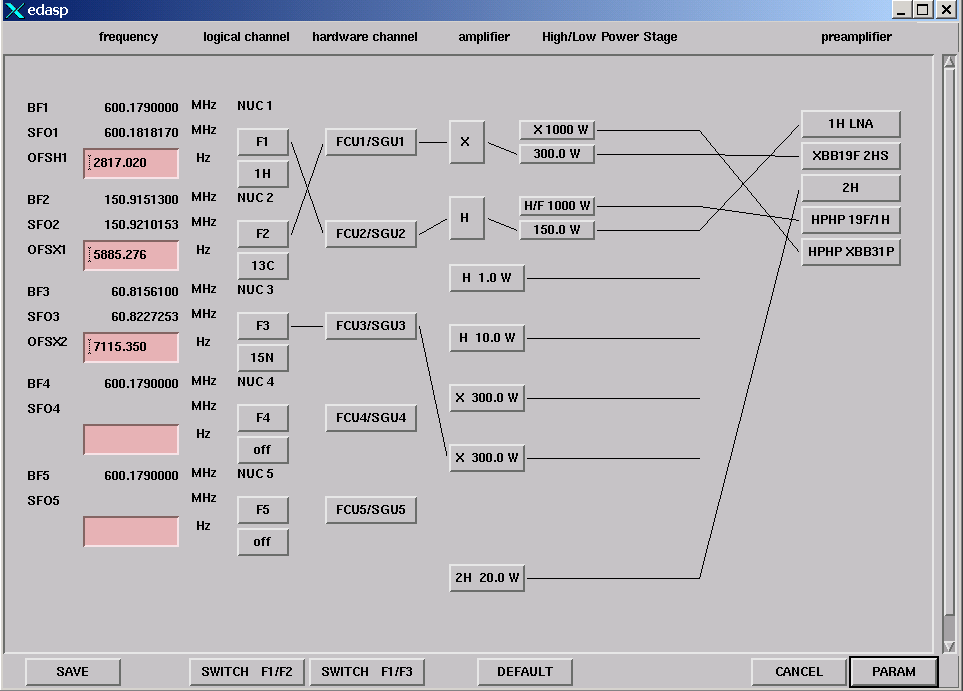
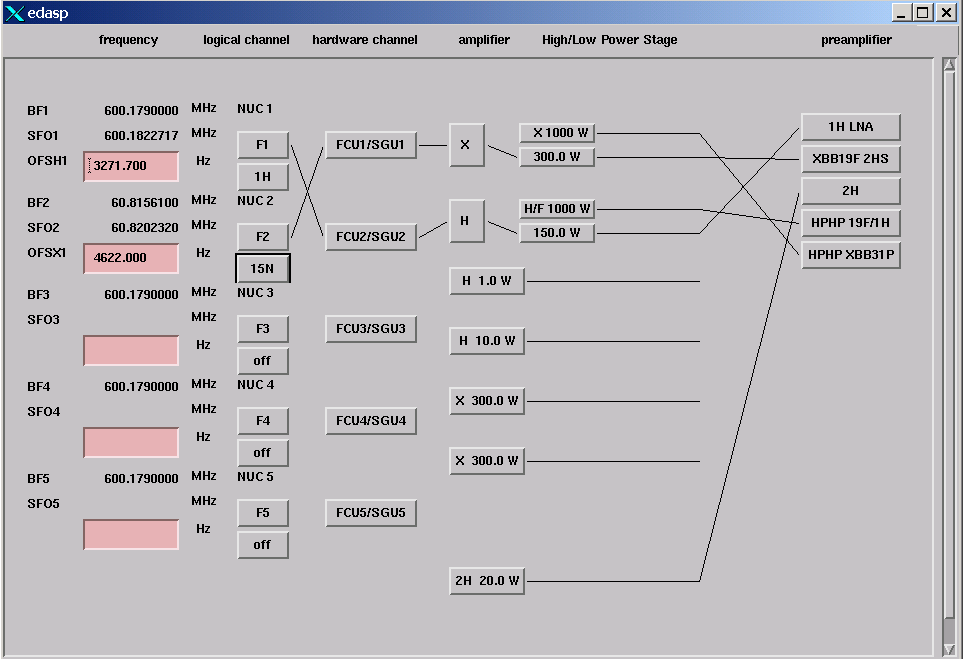 Channel SGU AMP Preamp Routing Map.png 963 × 659; 20 KB
 Copyfree.PNG 665 × 148; 38 KB
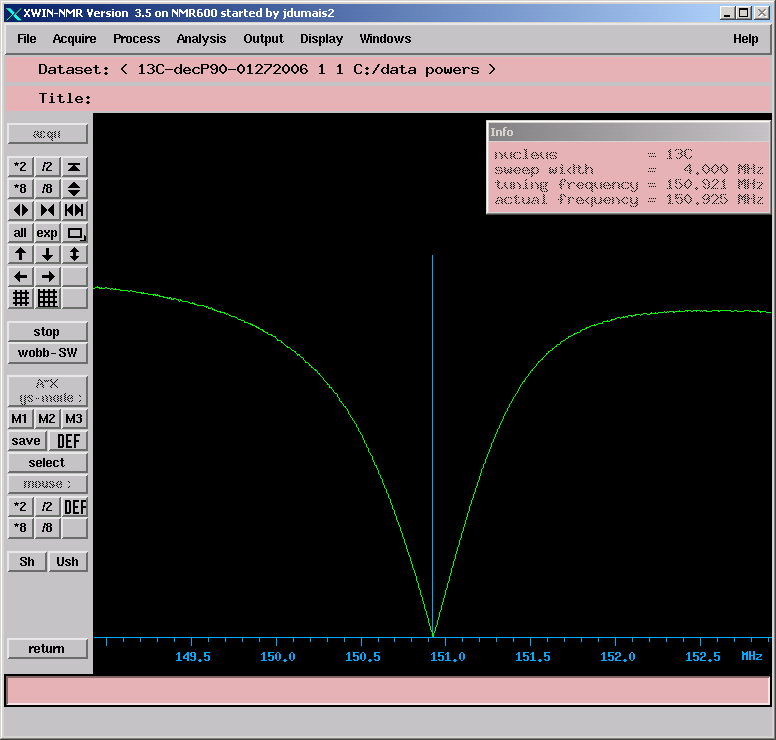 Correctly tuned and matched 13C signal.png 776 × 740; 18 KB
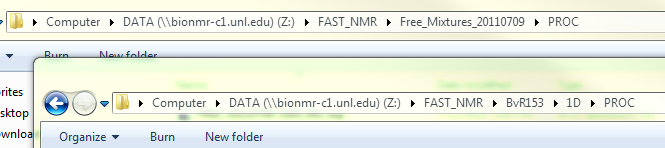
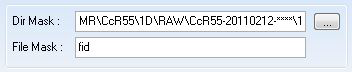 Dir Mask.png 352 × 72; 13 KB
 Doc1.pdf 0 × 0; 115 KB
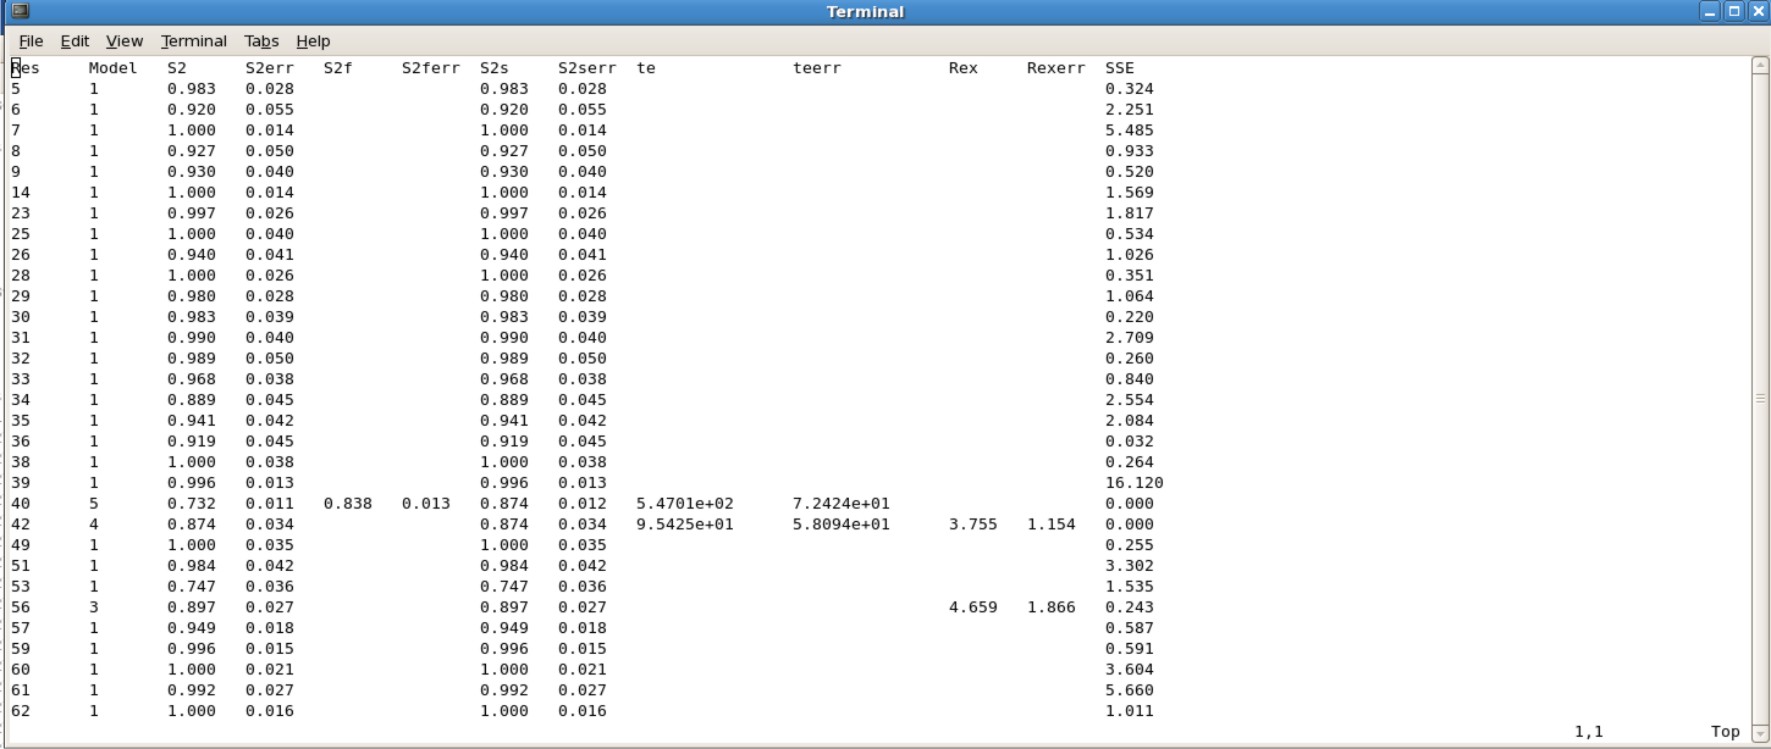
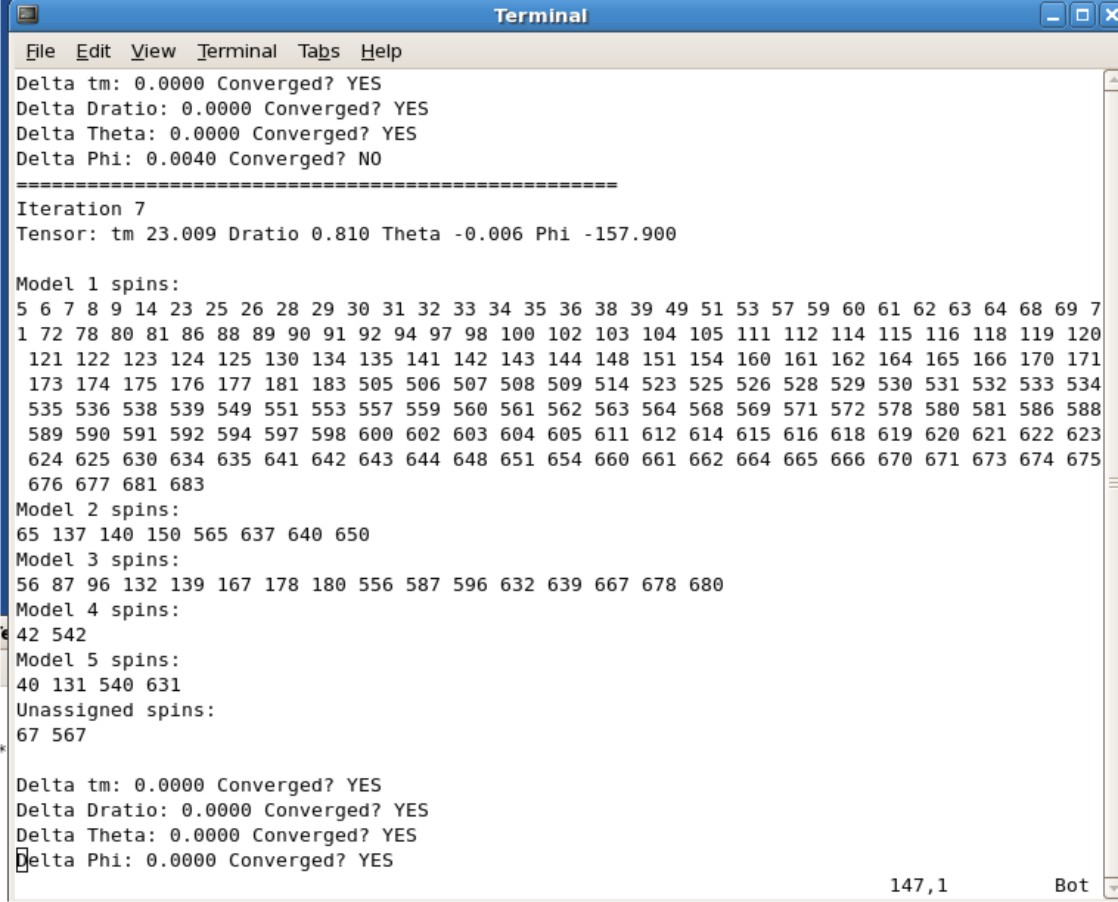
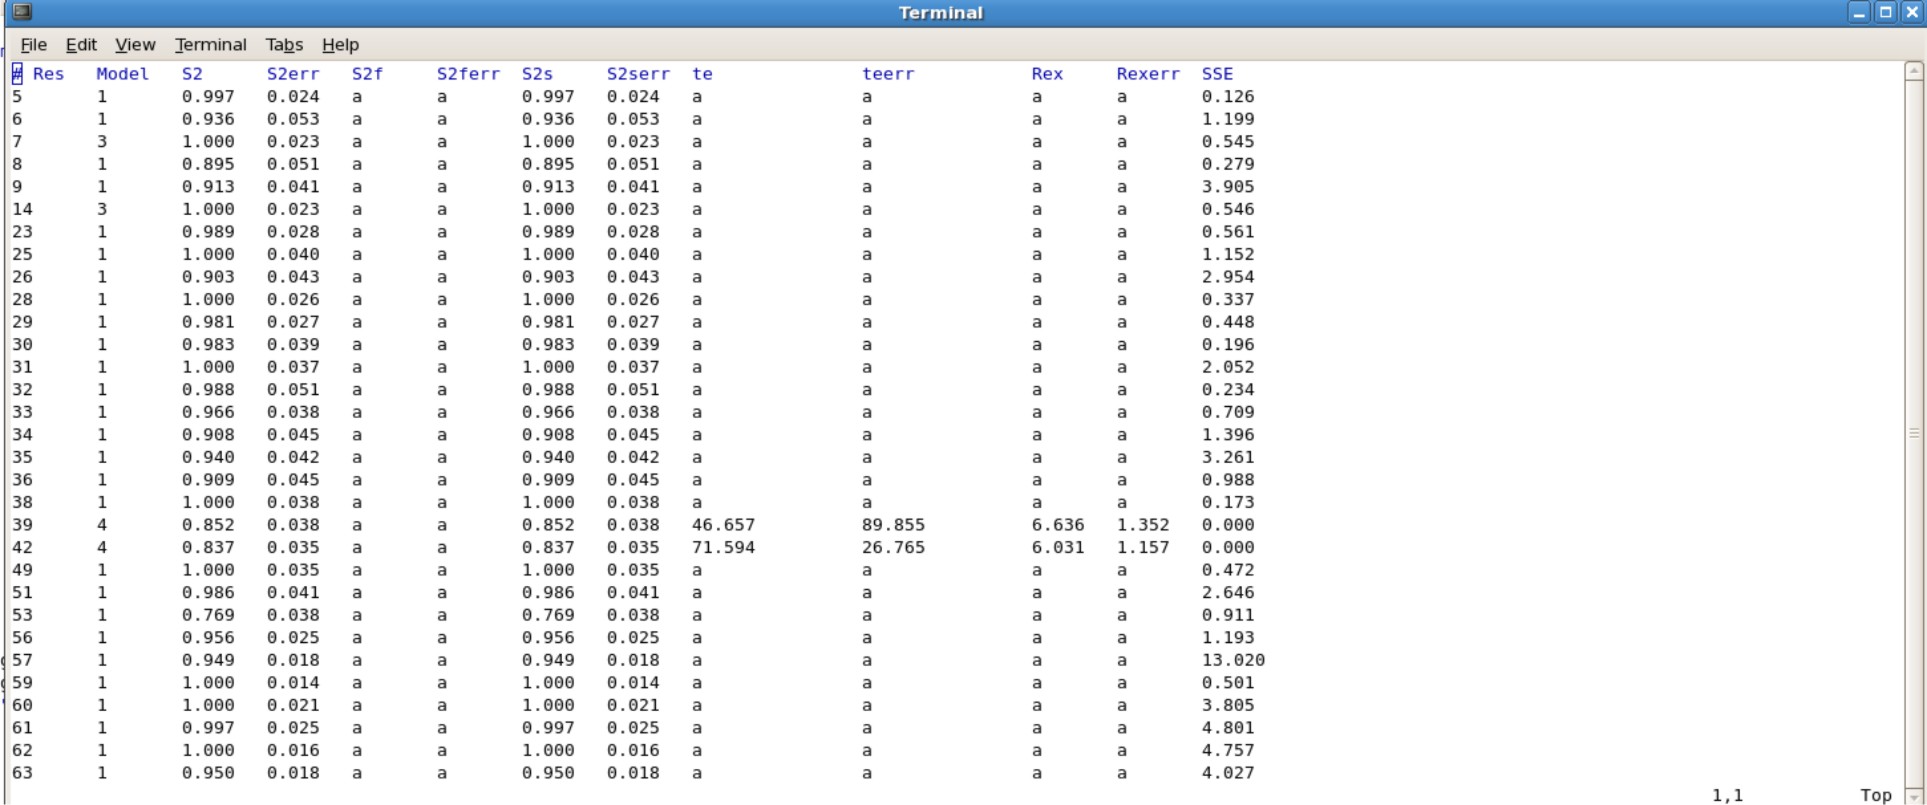 EditedFMFparresults.jpg 1,927 × 805; 194 KB
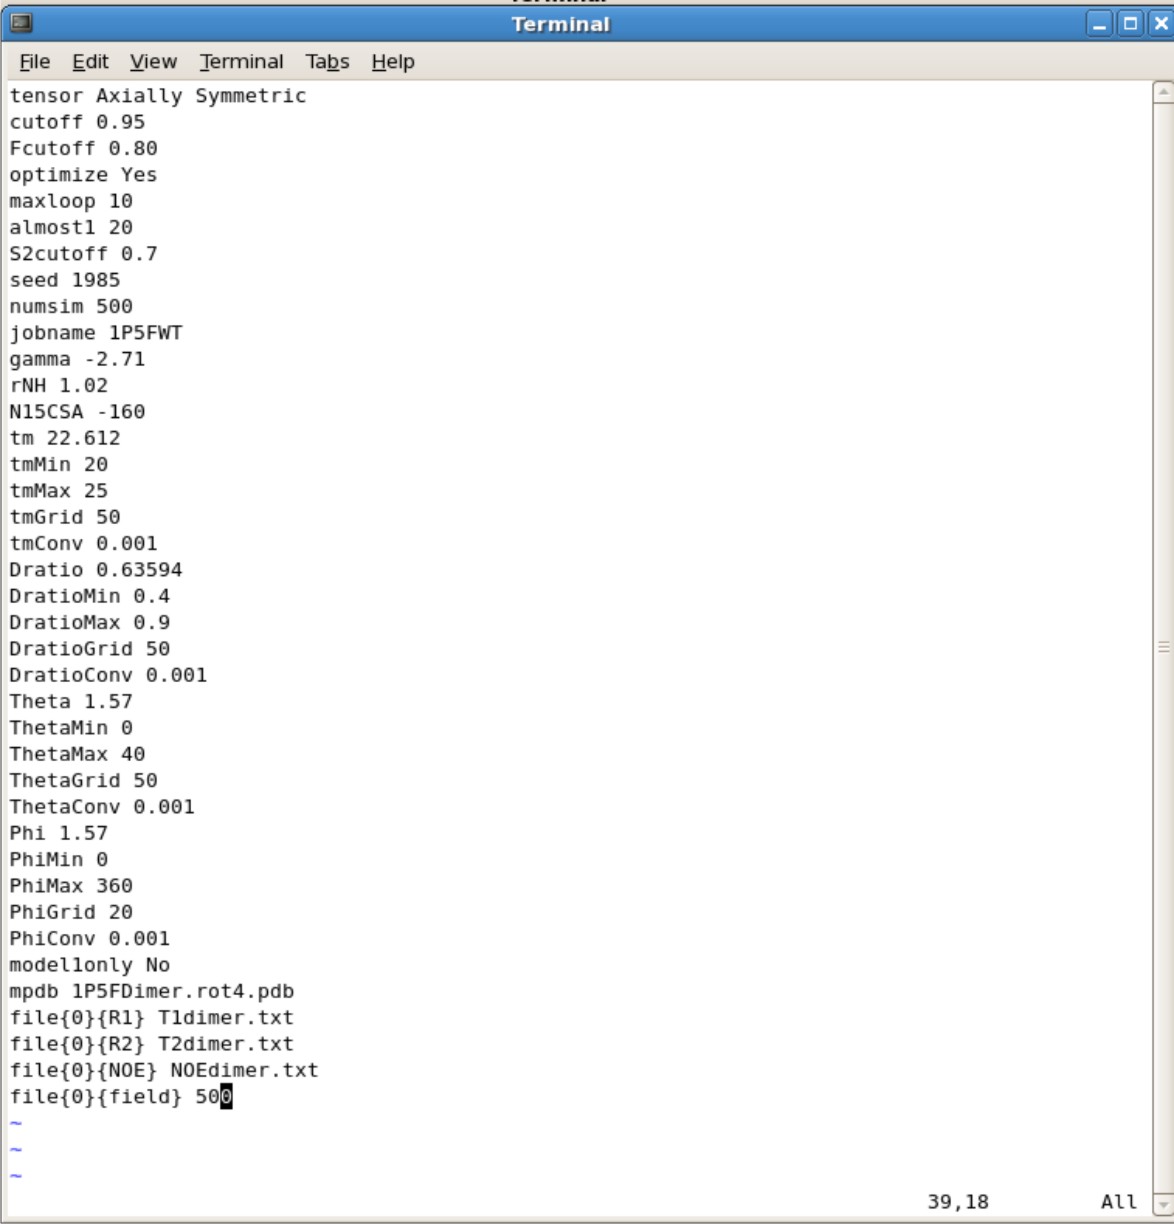
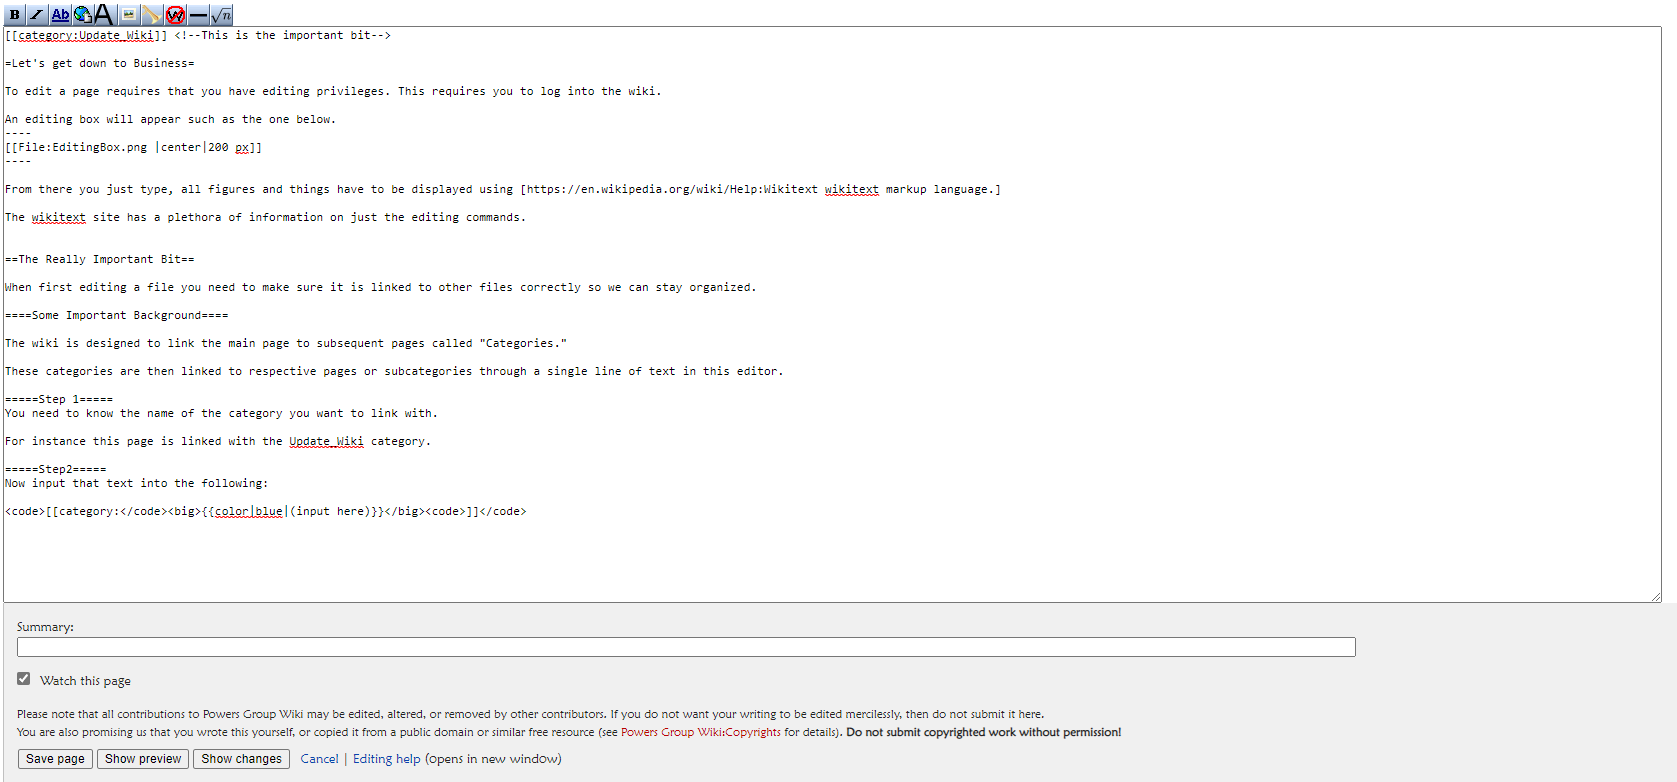 EditingBox.png 1,677 × 782; 72 KB
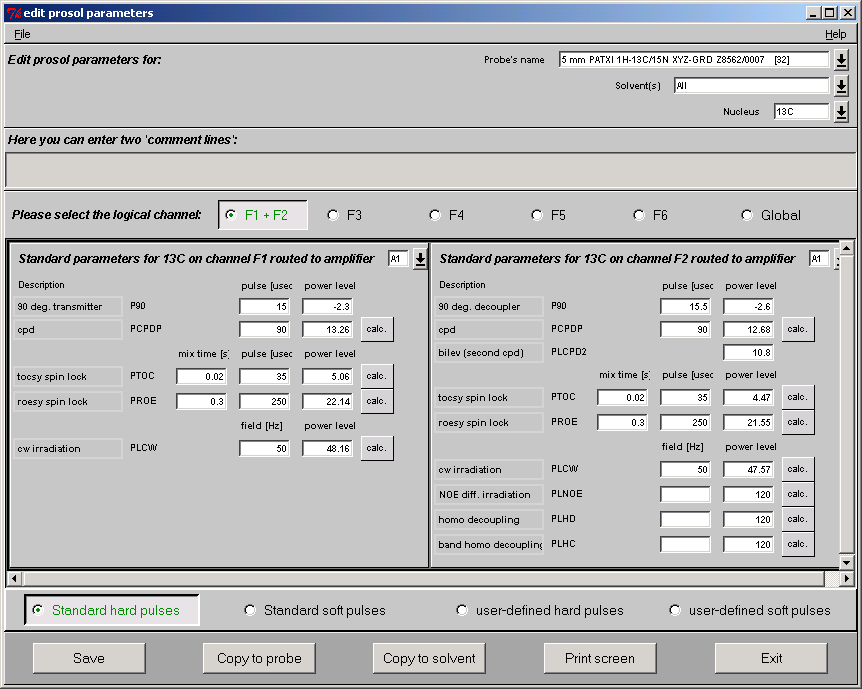 Edprosol for 13C.png 862 × 689; 20 KB
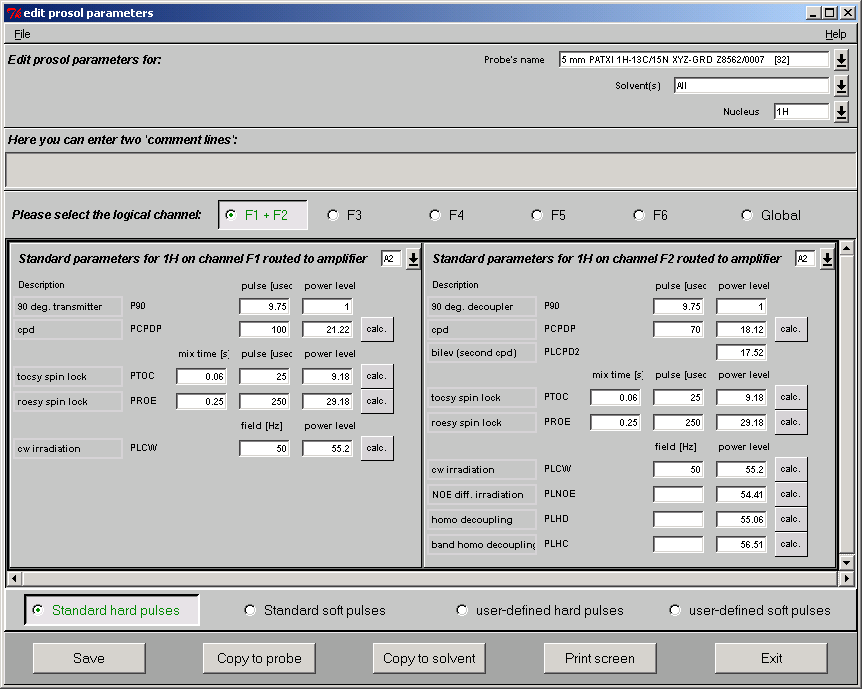 Edprosol for 1H.png 862 × 689; 20 KB
 Edprosol window for entering 15N decouple pulse power 3.png 862 × 689; 18 KB
 FMFconfig.jpg 1,174 × 1,224; 121 KB
 FMFparresults.jpg 1,771 × 749; 163 KB
 FMFresultslog.jpg 1,118 × 902; 180 KB
 GroupPicture.png 1,303 × 486; 1.52 MB
- NMR MC Sub Mon2013 Example.docx ; 16 KB
- NMR Tube Deep Clean.docx ; 150 KB
 Namechange.csh.txt ; 644 bytes
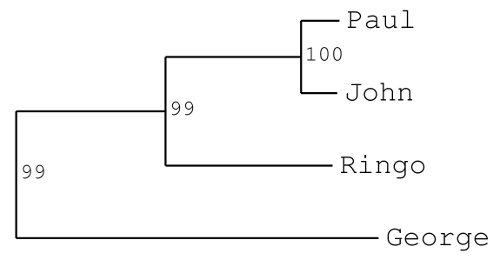
- PCA2Tree102.awk.txt ; 21 KB
 Plot.png 500 × 260; 5 KB
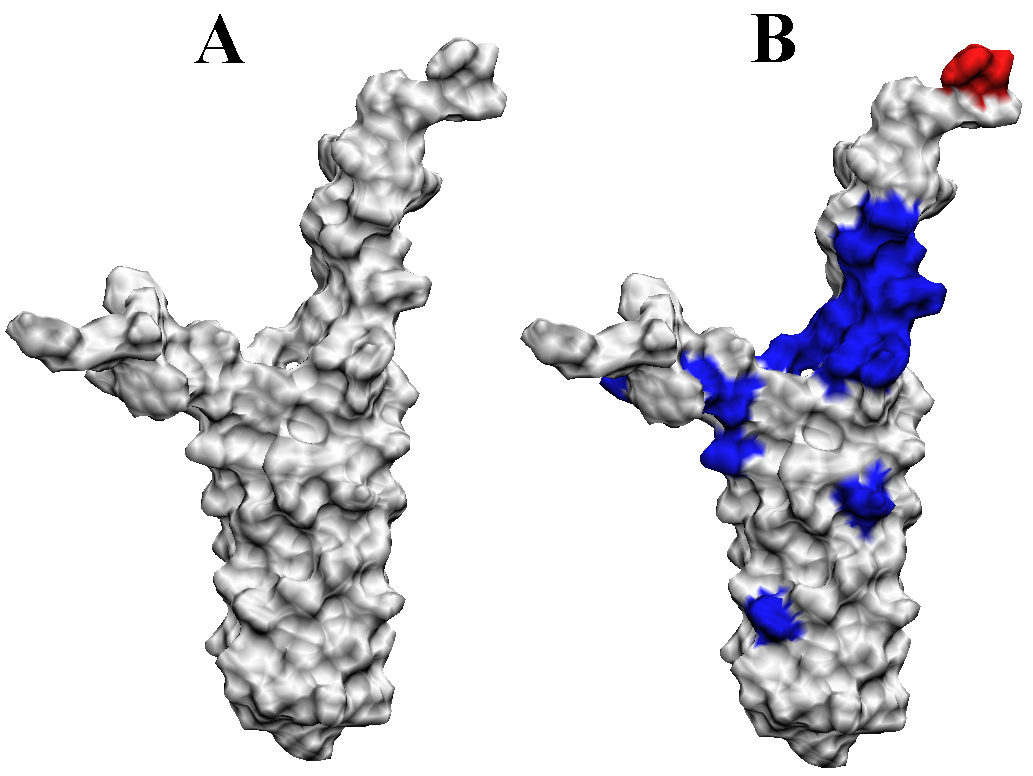 Protocol mapping chemical shift changes to protein structures.png 1,033 × 776; 403 KB
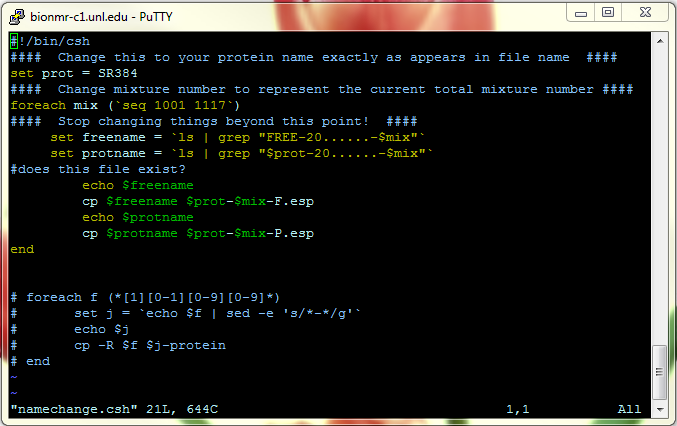 Puttynamechange.PNG 677 × 426; 51 KB
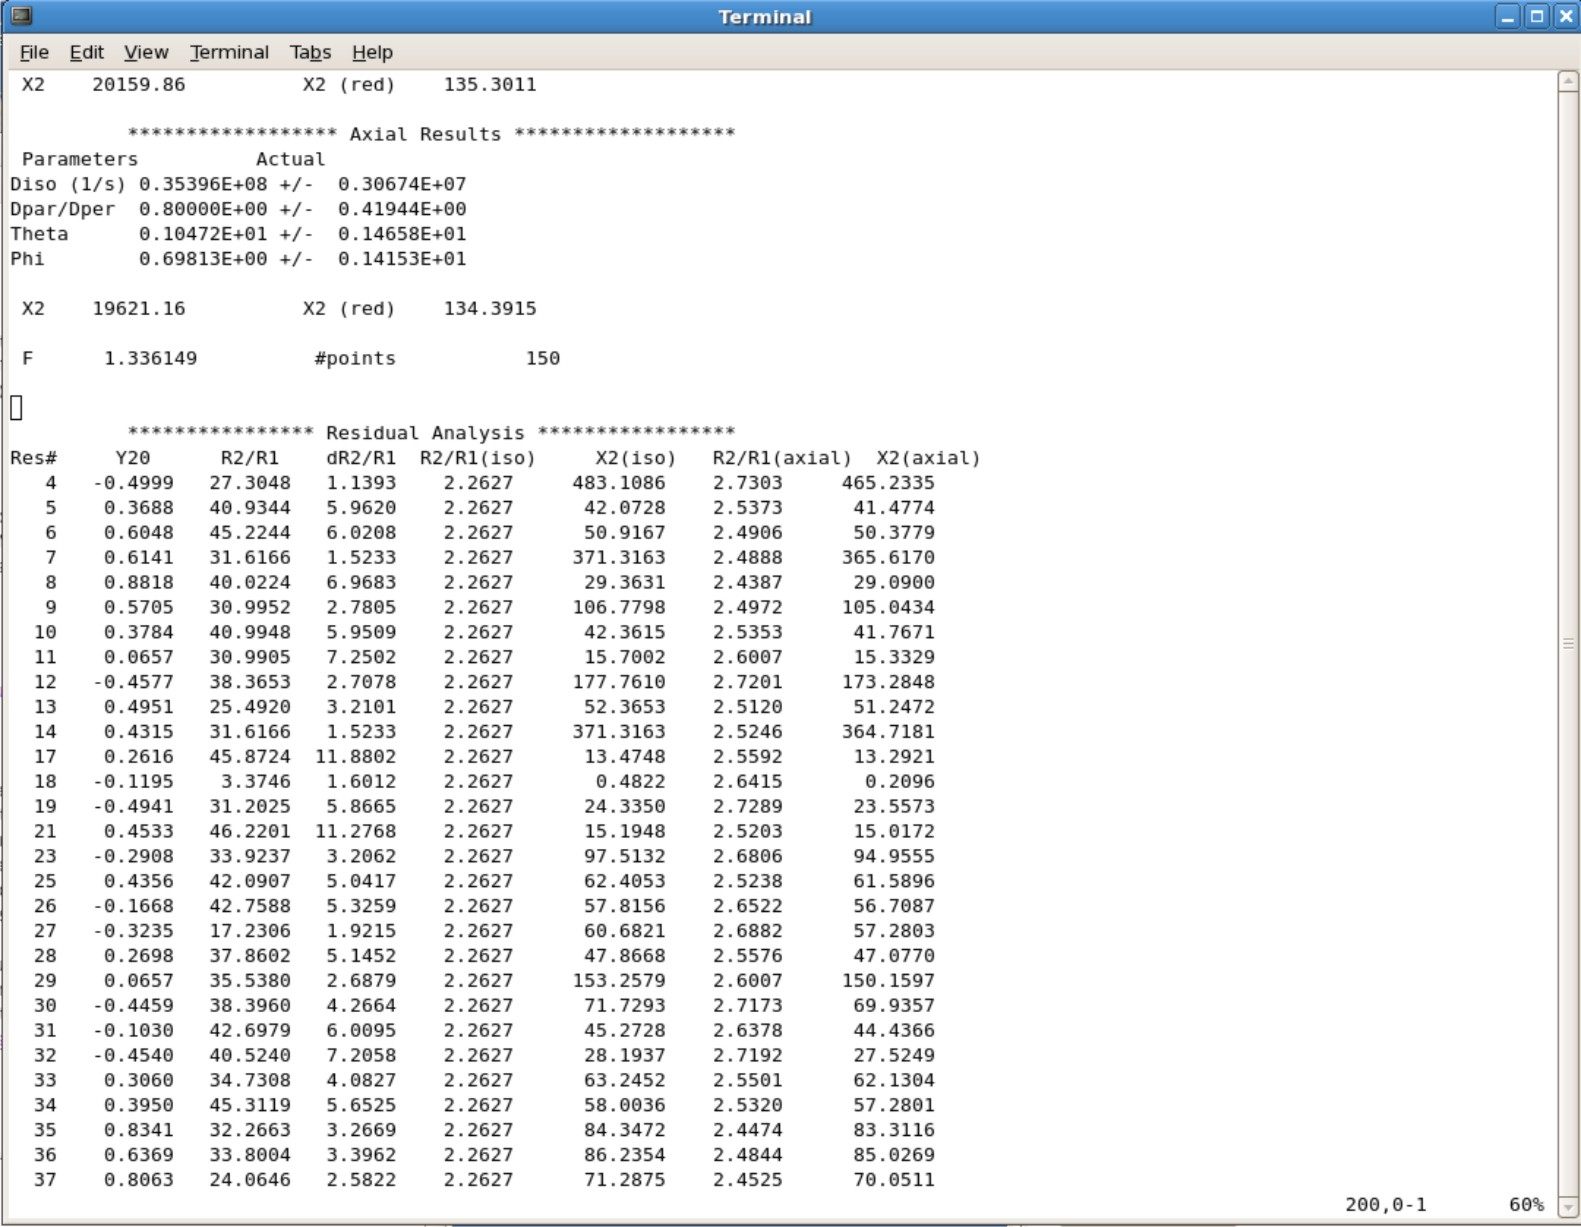
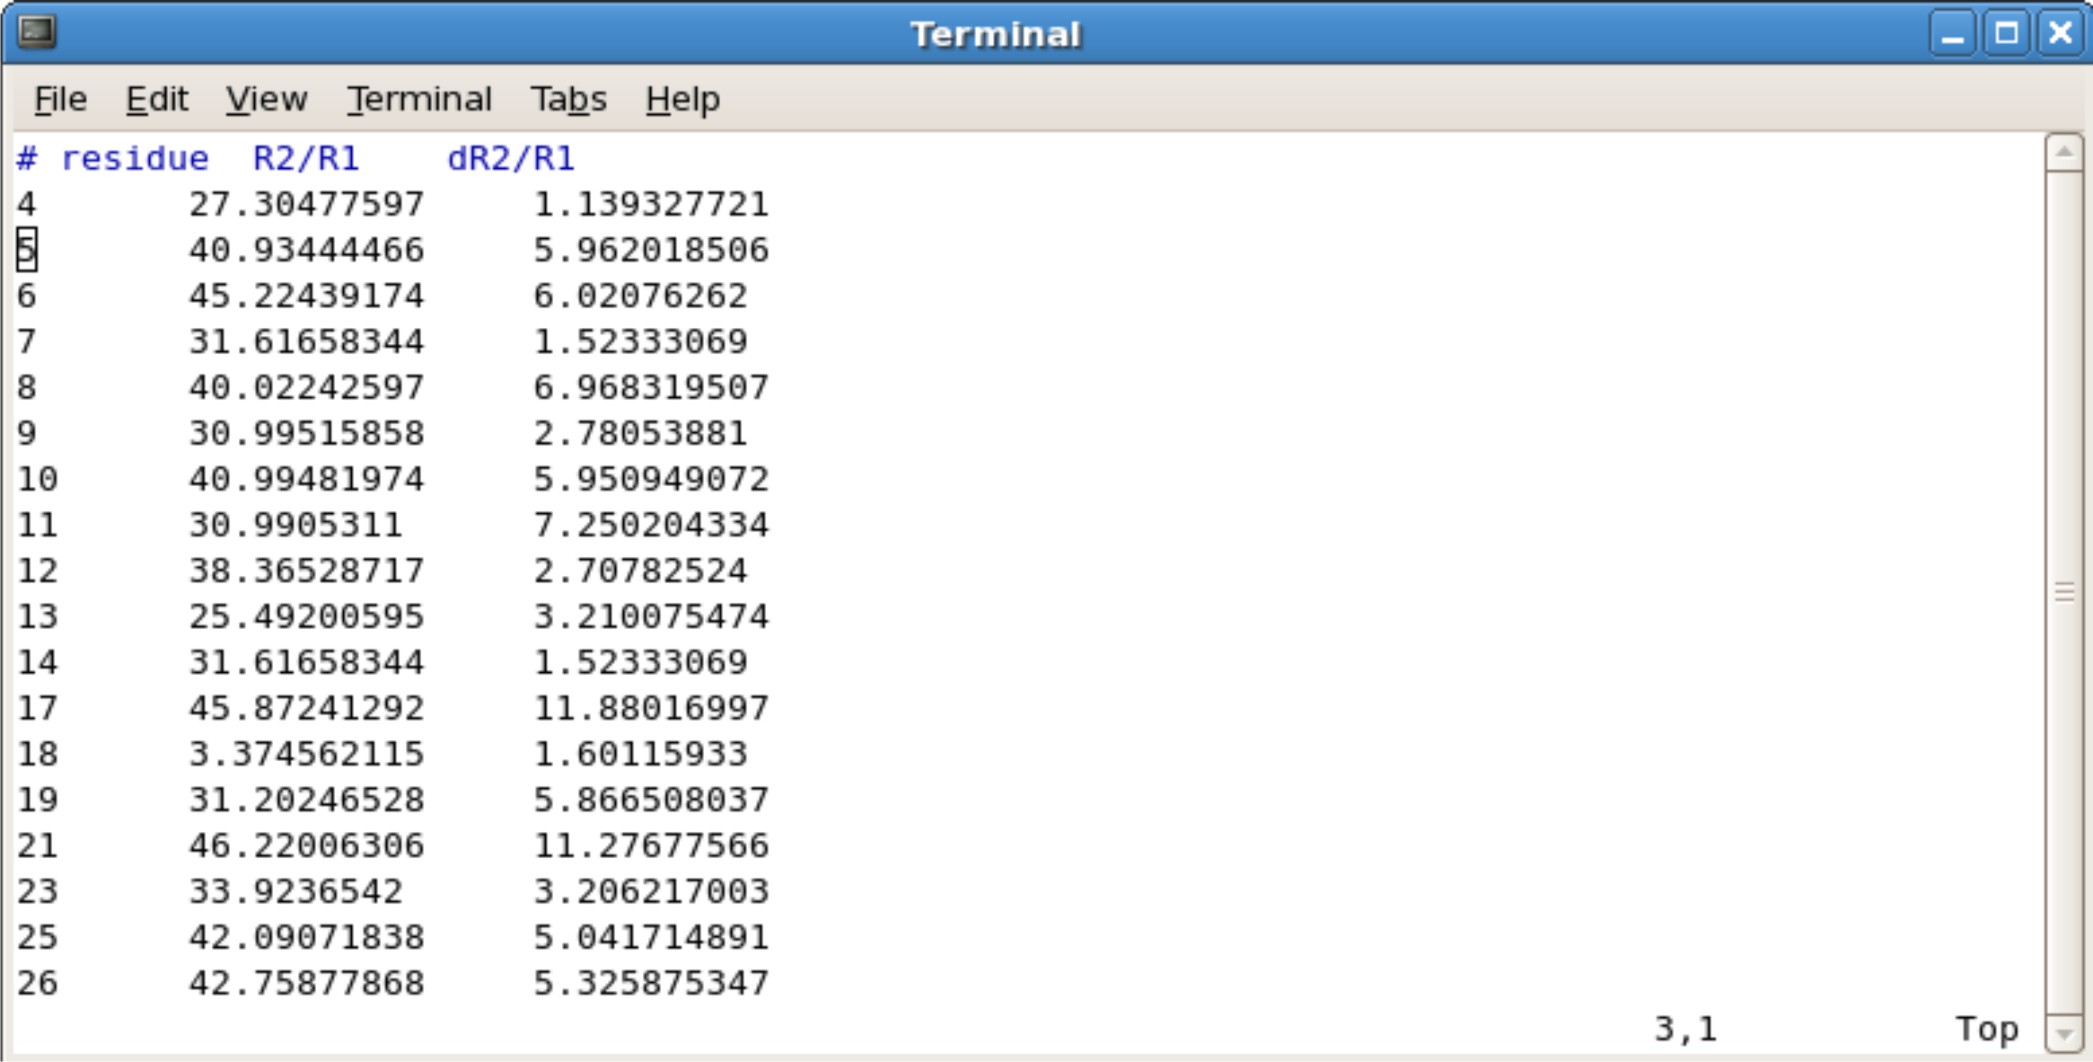 R2-R1example.jpg 2,093 × 1,062; 198 KB
 Relaxationgraph.jpg 1,666 × 1,241; 265 KB
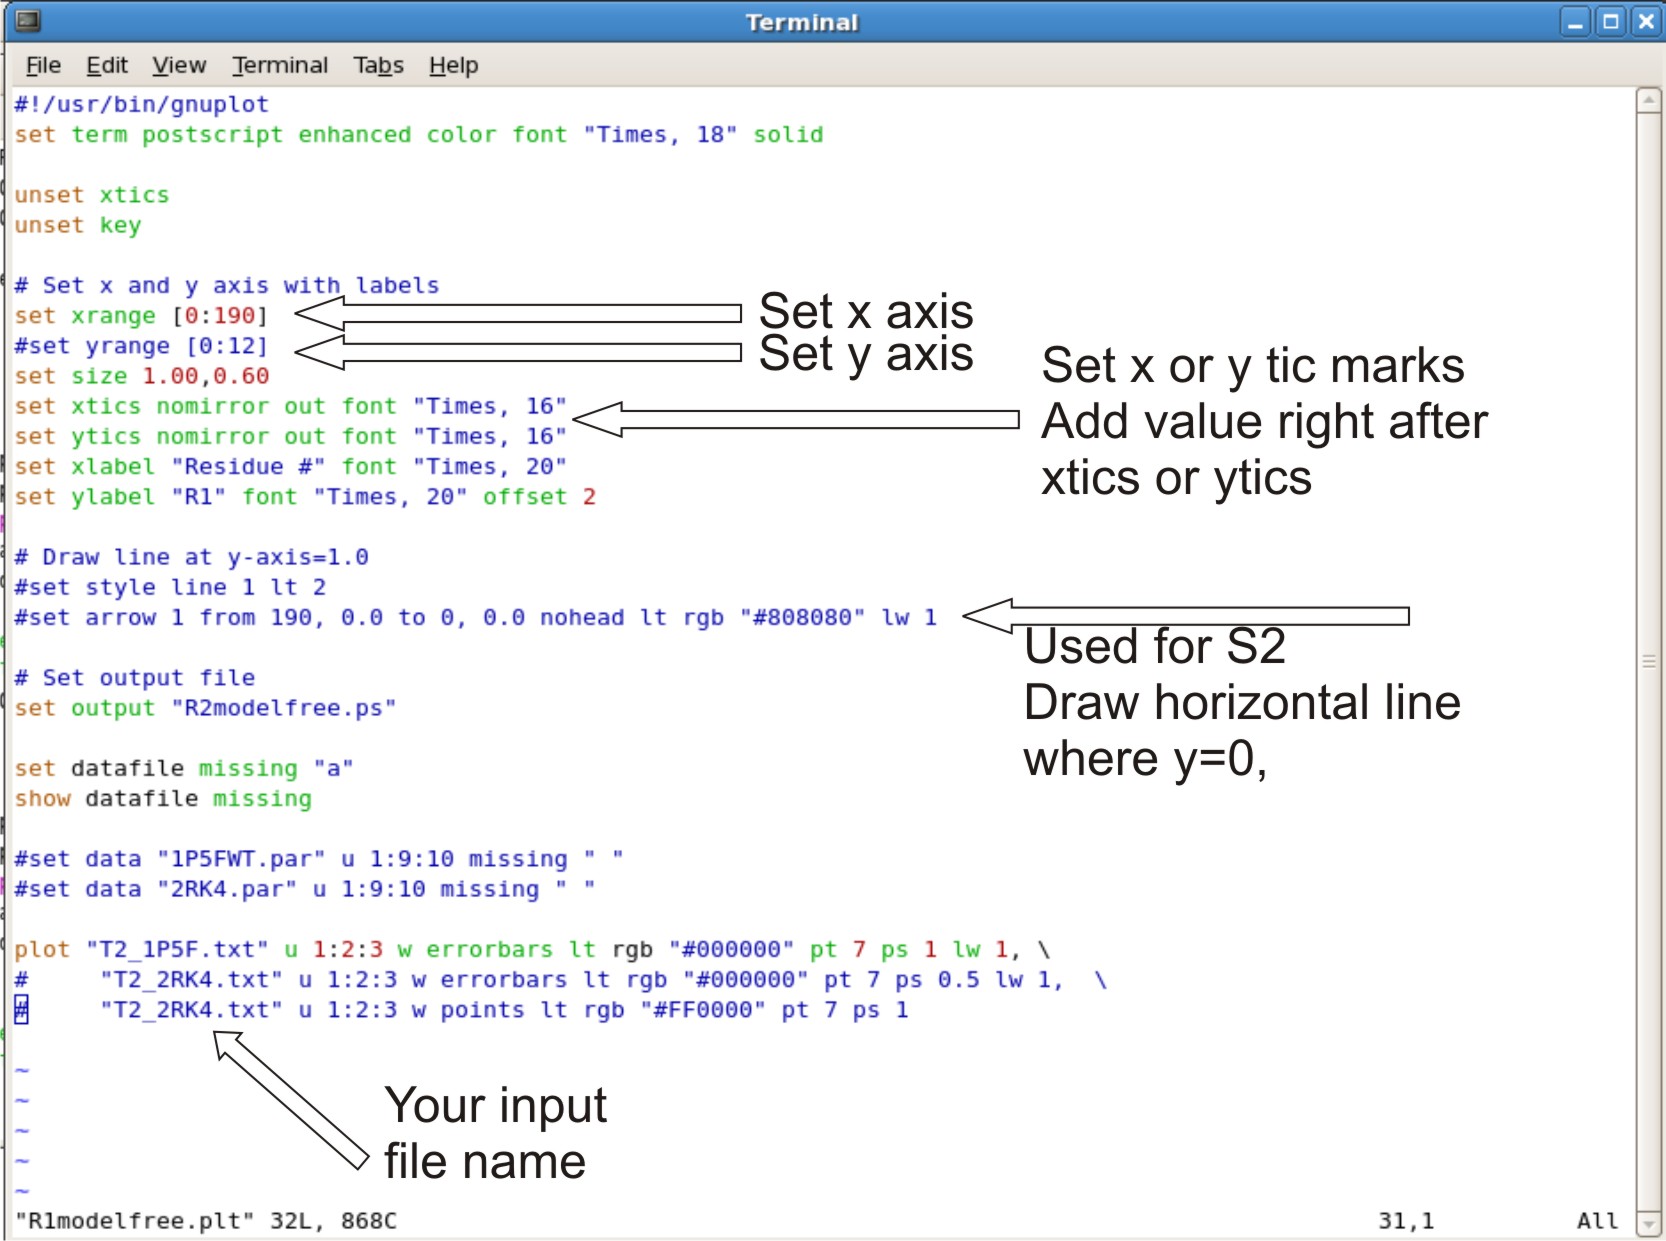
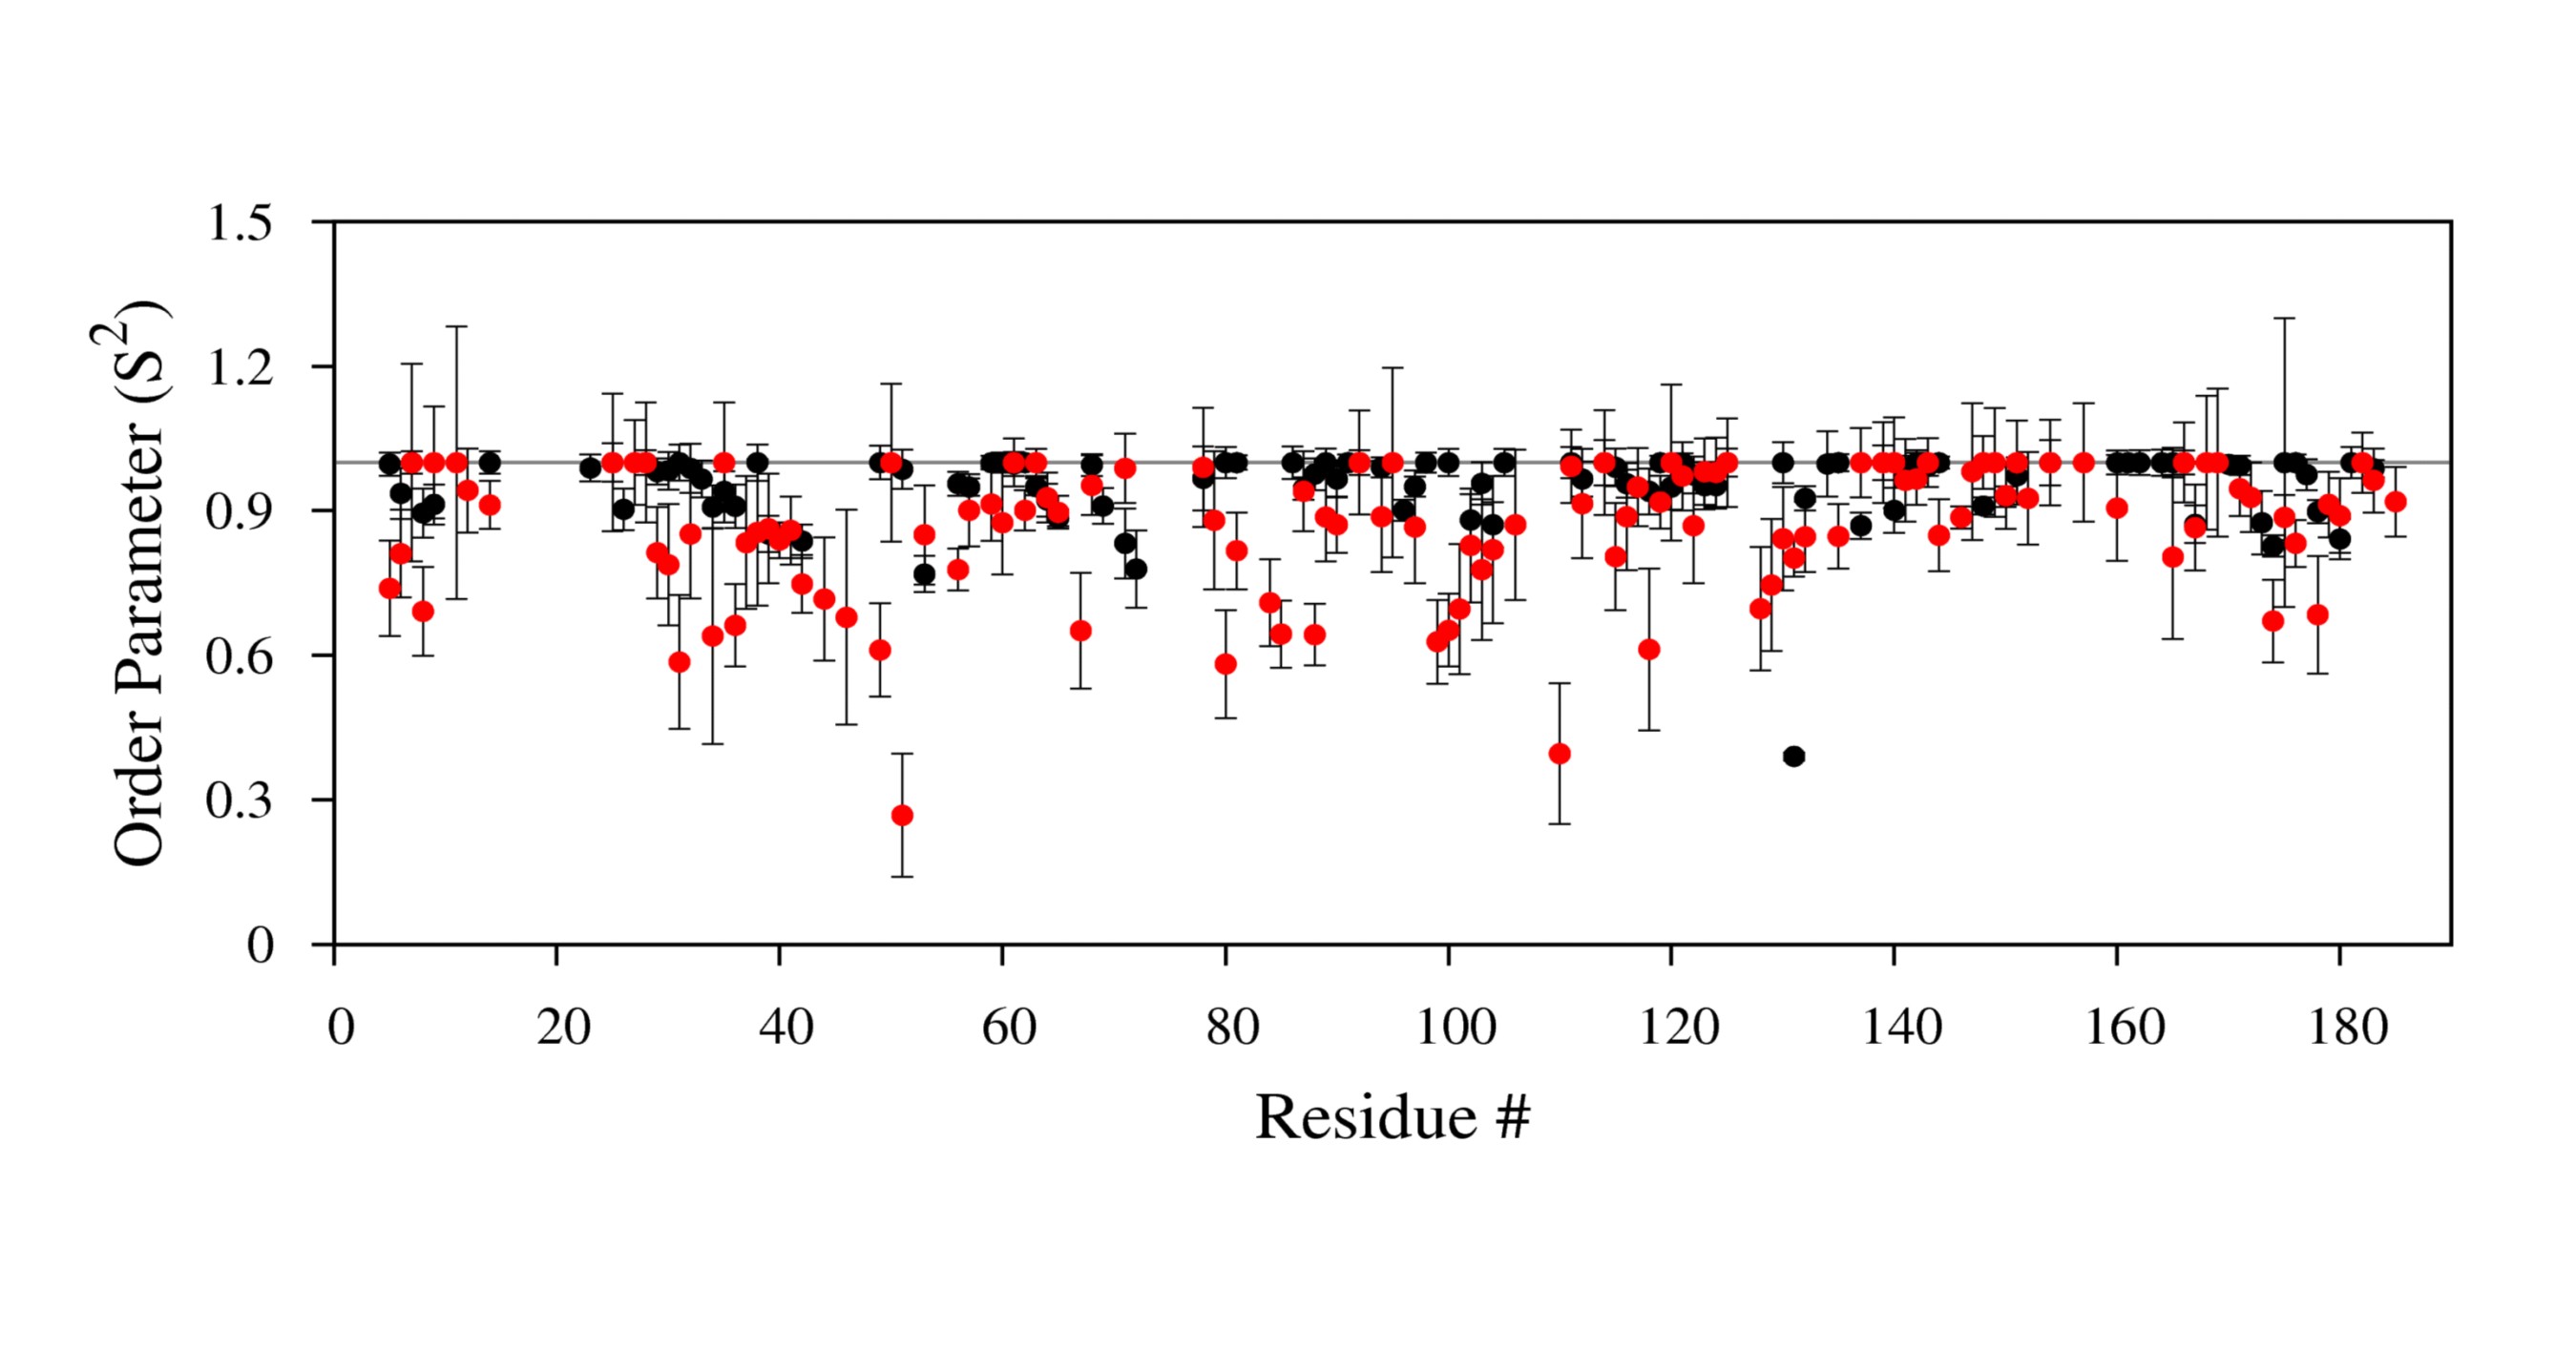 S2plot.jpg 2,699 × 1,416; 239 KB
- SDS PAGE.pdf 0 × 0; 741 KB
 Standard Channel SGU AMP Preamp Routing Map.png 963 × 691; 22 KB
- Structure energy table.doc ; 42 KB
 TableProbe.png 1,388 × 225; 17 KB
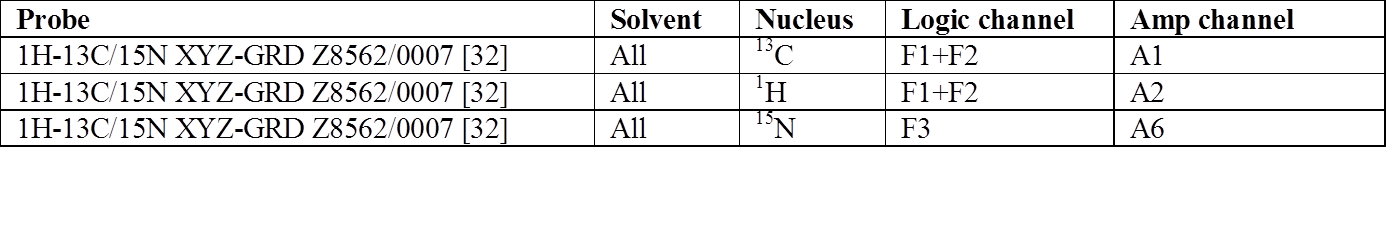 TableProbe2.png 1,388 × 225; 27 KB
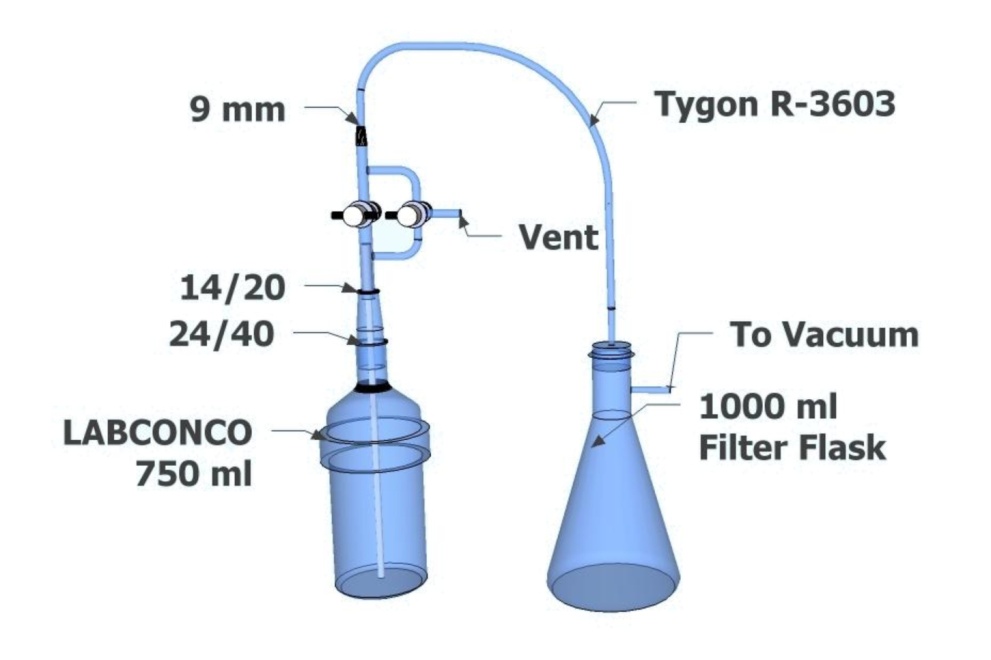 Tubewasher1.jpg 991 × 660; 73 KB
 Tubewasher2.jpg 918 × 796; 63 KB
 Ubiqoutput.jpg 1,581 × 1,227; 297 KB
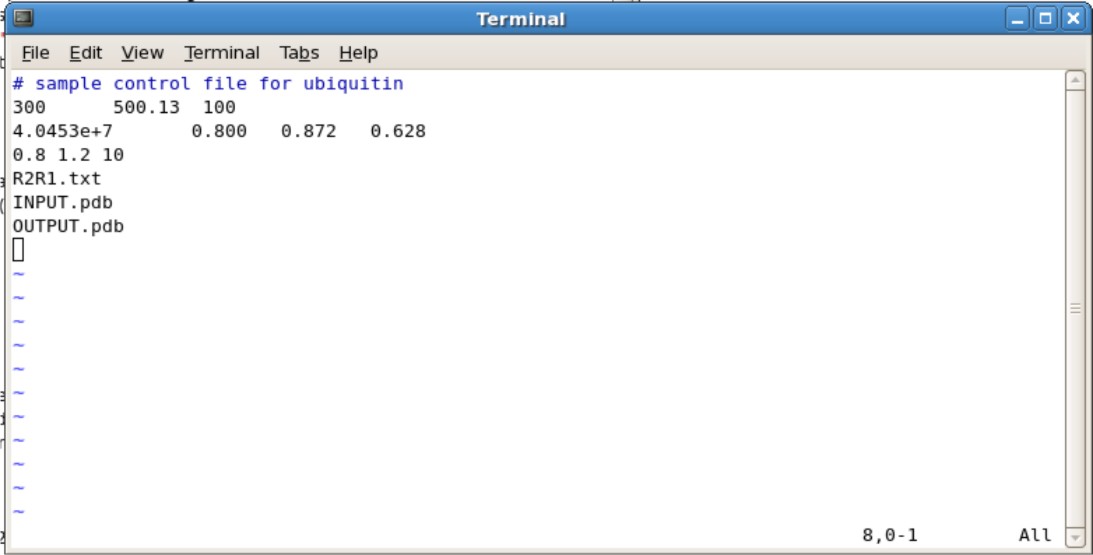 Ubqinputexample.jpg 1,093 × 555; 58 KB
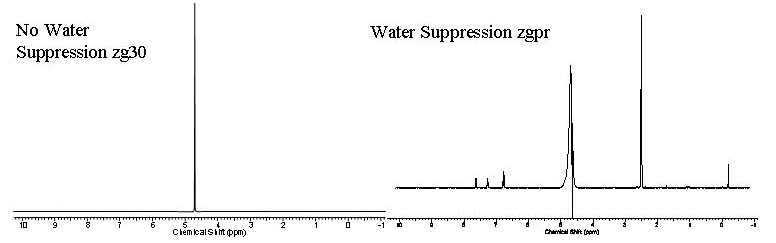
 Water suppression spectrum.png 776 × 243; 30 KB
 Wiki.png 776 × 243; 67 KB
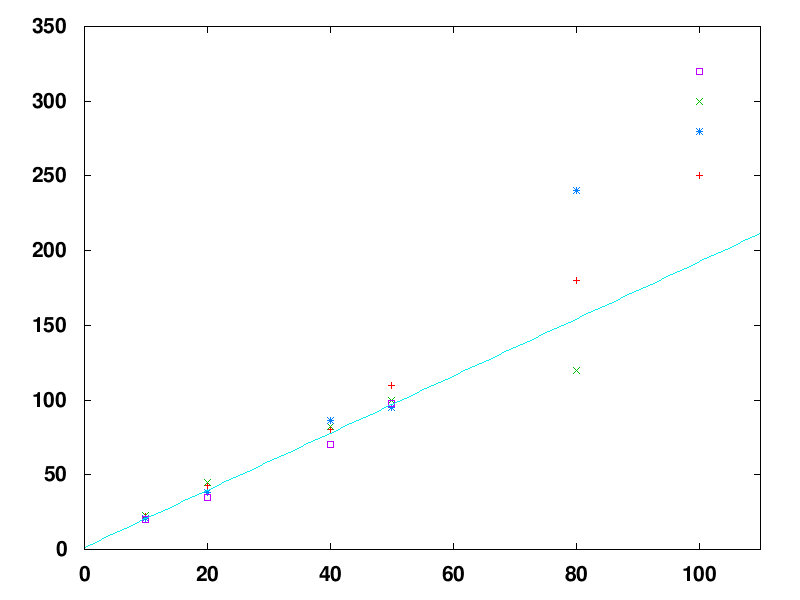 Wlls-example.png 800 × 600; 6 KB
- Wlls-example.txt ; 125 bytes
- Wlls-example.xlsx ; 8 KB
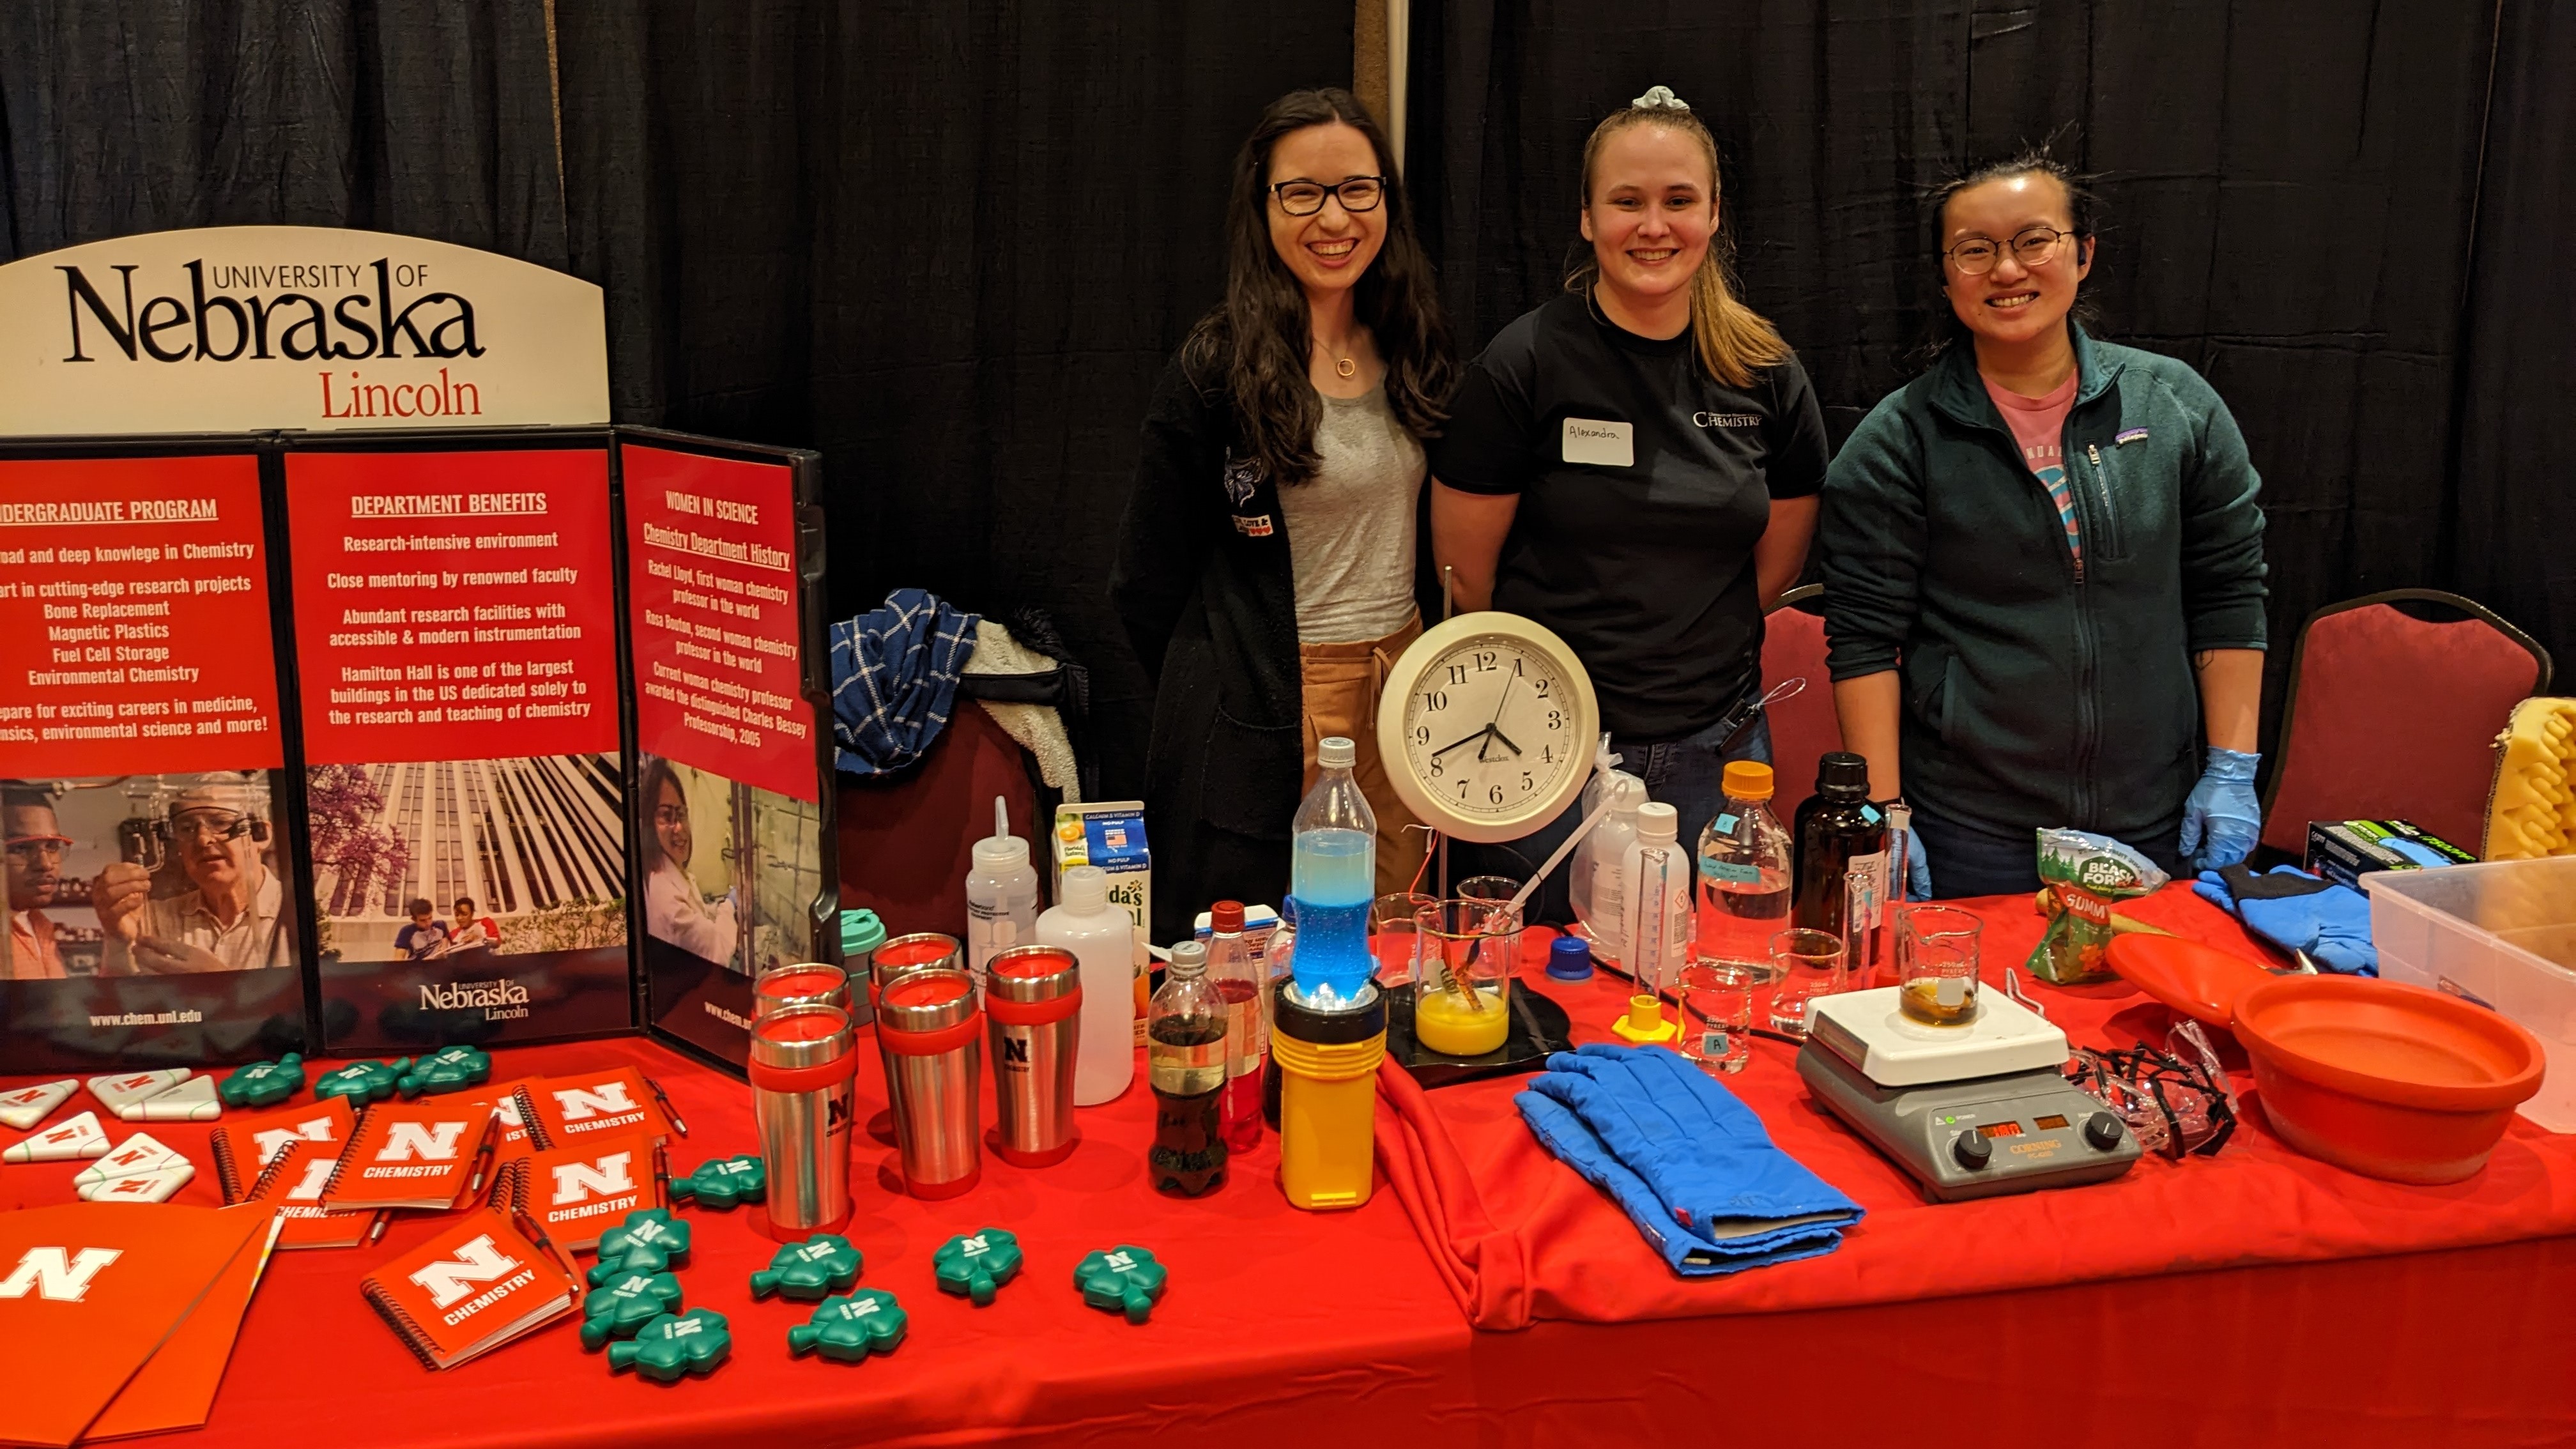 WomenInScience.jpg 4,032 × 2,268; 1.57 MB
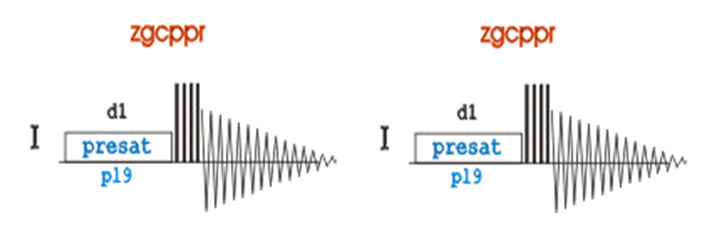 ZGPR ZGCPPR pulse sequence.png 702 × 244; 41 KB
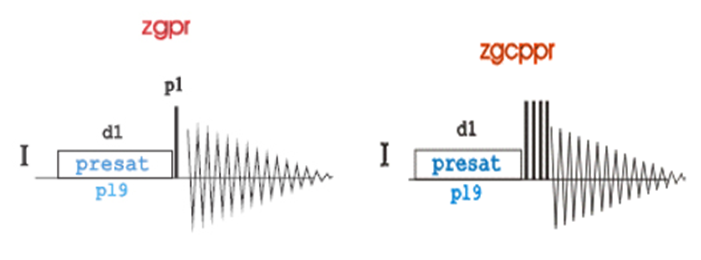 ZGPR ZGCPPR pulse sequence .png 701 × 260; 69 KB
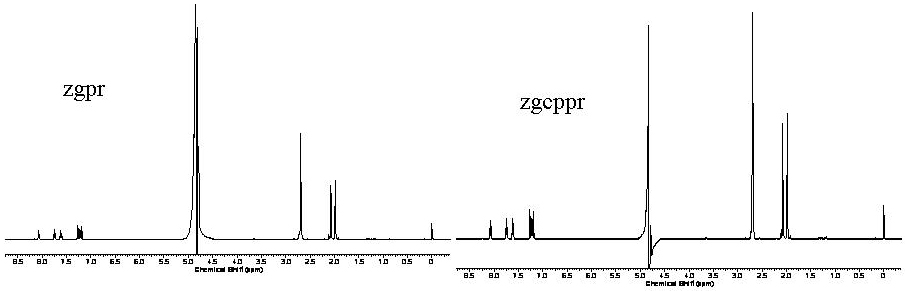 ZGPR ZGCPPR spectrum.png 905 × 291; 37 KB


